Commvault: Fiscal 2Q25 Financial Results
Revenue at $233 million, up 16% Y/Y, 4th consecutive quarter of double-digit growth
This is a Press Release edited by StorageNewsletter.com on October 30, 2024 at 2:02 pm
| (in $ million) | 2Q24 | 2Q25 | 6 mo. 24 | 6 mo. 25 |
| Revenue | 201.0 | 233.3 | 399.1 | 457.9 |
| Growth | 16% | 15% | ||
| Net income (loss) | 13.0 | 15.6 | 25.6 | 34.1 |
Commvault Systems, Inc. announced its financial results for the fiscal second quarter ended September 30, 2024.
“Keeping customers resilient and their businesses continuous has never been more critical than it is today“, said Sanjay Mirchandani, president and CEO. “Our strong execution and increasing demand for our innovative Commvault Cloud platform has not only resulted in our 4th consecutive quarter of double-digit revenue growth, but it has given us the confidence to once again raise our outlook for the full fiscal year.”
2FQ25 Highlights
- Total revenues were $233.3 million, up 16% Y/Y
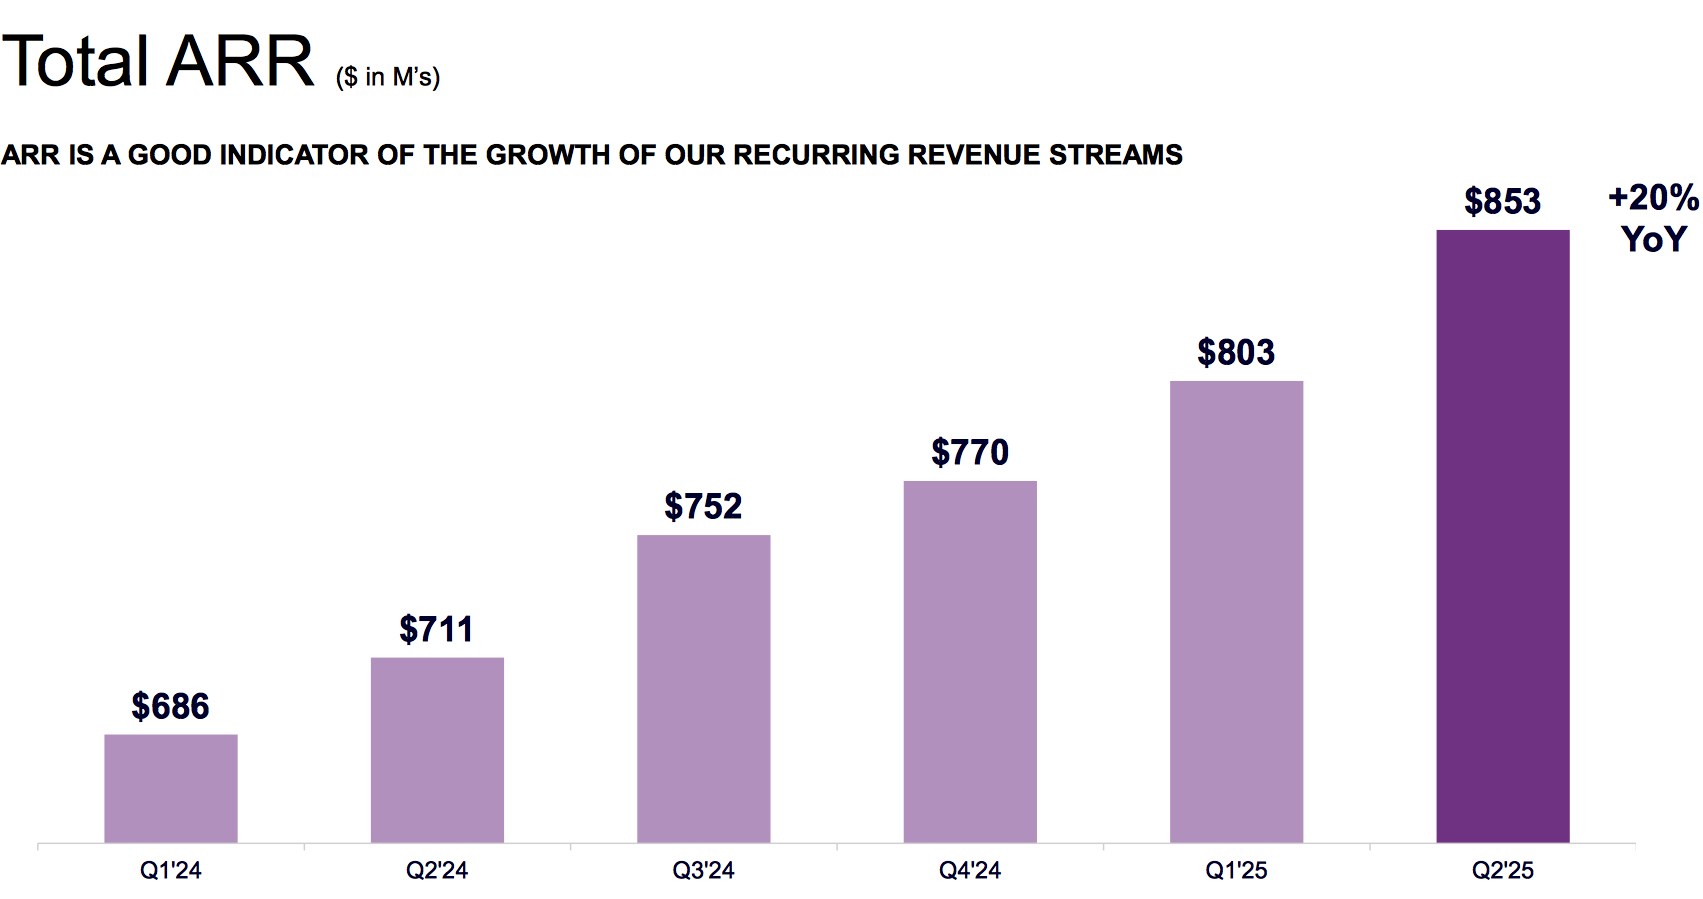
- Total ARR grew to $853 million, up 20% Y/Y
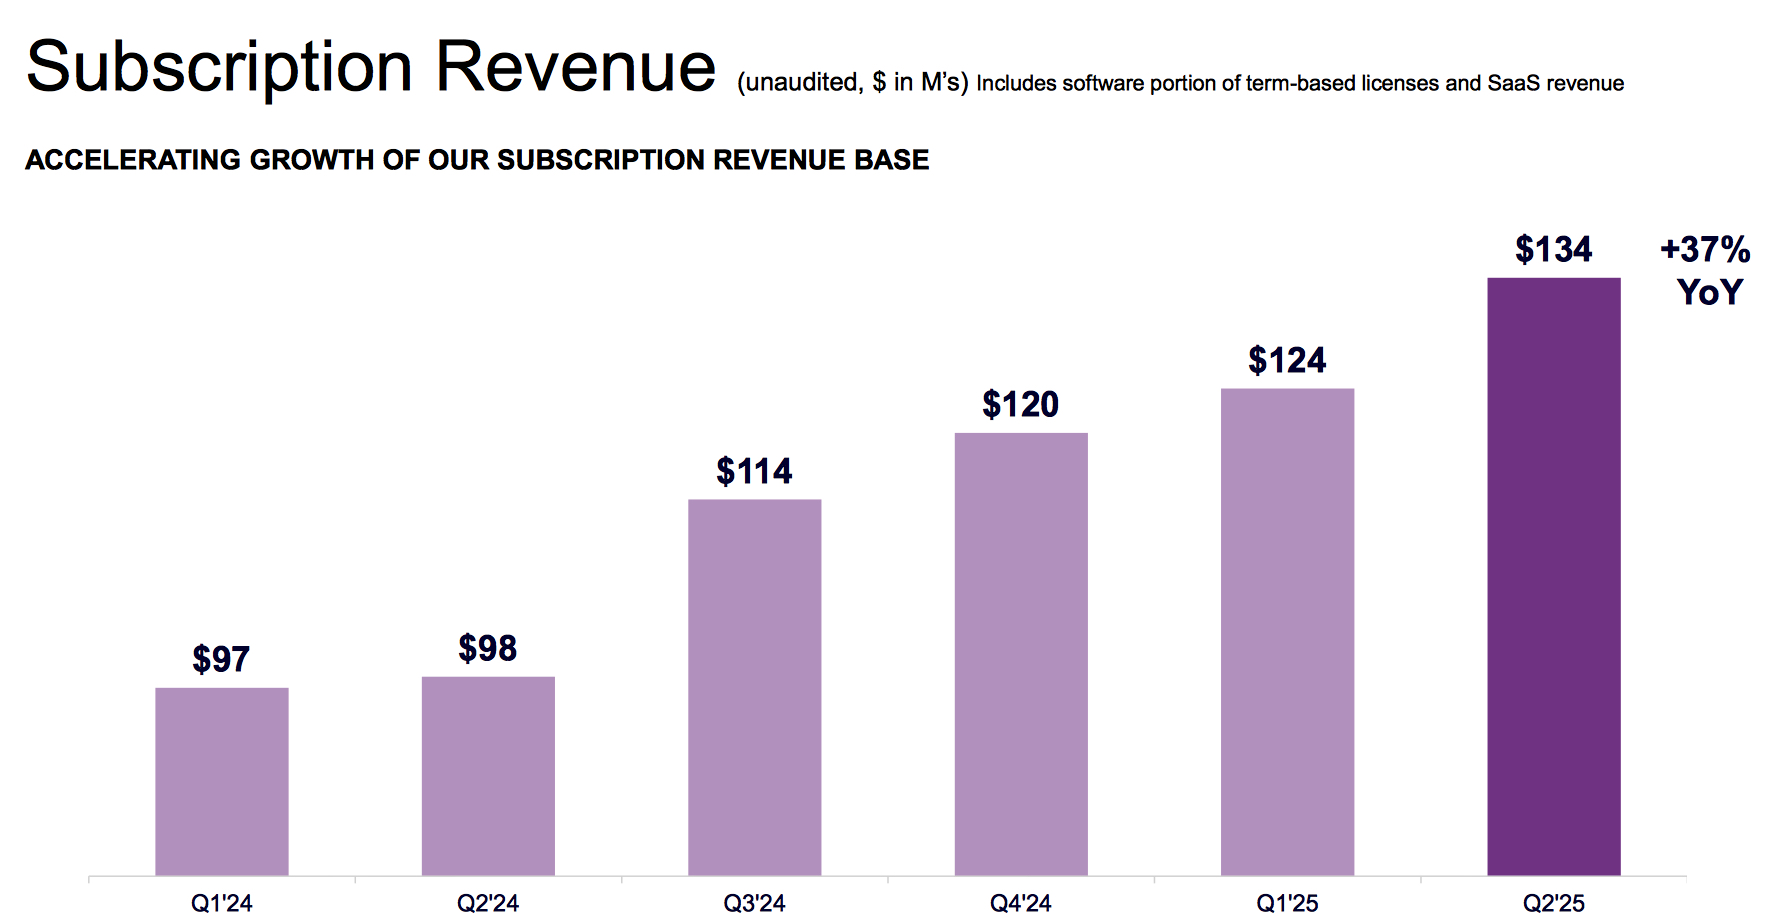
- Subscription revenue was $134.0 million, up 37% Y/Y
- Subscription ARR grew to $687 million, up 30% Y/Y
- Income from operations (EBIT) was $15.0 million, an operating margin of 6.4%
- Non-GAAP EBIT was $47.7 million, an operating margin of 20.5%
- Operating cash flow was $55.6 million, with free cash flow of $53.7 million
- 2FQ25 share repurchases were $51.9 million, or approximately 363,000 shares of common stock
Guidance for 3FQ25:
- Total revenue is expected to be between $243 million and $247 million
- Subscription revenue is expected to be between $143 million and $147 million
- Non-GAAP operating margin is expected to be between 20% and 21%
Guidance for FY25:
- Total revenue is expected to be between $952 million and $957 million
- Total ARR is expected to grow 18% Y/Y
- Subscription revenue is expected to be between $552 million and $557 million
- Subscription ARR is expected to grow between 26% and 28% Y/Y
- Non-GAAP operating margin is expected to be between 20% and 21%
- Free cash flow is expected to be at least $200 million
Comments
Total revenue was $233.3 million, up 16% Y/Y, above guidance between $218 million and $222 million.

Total ARR accelerated 20% to $853 million, subscription ARR rose 30% to $687 million. SaaS ARR jumped 64% to $215 million and now represents 25% of our total ARR. And free cash flow grew 34% to $54 million, with 97% of that free cash flow returned through share repurchases.

Growth in subscription revenue came from both increased contributions from SaaS portfolio and continued double-digit growth in term software licenses, well ahead of the market growth rate. The contribution from term software transactions exceeding $100,000 increased by 23% and benefited from a 12% increase in the average deal size. This expansion reflects a healthy sales mix of autonomous and Cyber Resilience bundles. 2FQ25 customer support revenue, which includes support for both churn-based and perpetual software licenses, grew 1% to $78 million.
Customer support revenues derived from term software and related arrangements now represents 54% of customer support revenue, up 800 basis points compared to only 46% in 2FQ24. 2FQ25 total ARR growth accelerated 20% to $853 million. Subscription ARR encompassing term-based licenses and SaaS contracts, increased by 30% reaching $687 million or 81% of total ARR. This includes $215 million in SaaS ARR, which increased 64% Y/Y, continuing along its hyper growth trajectory.

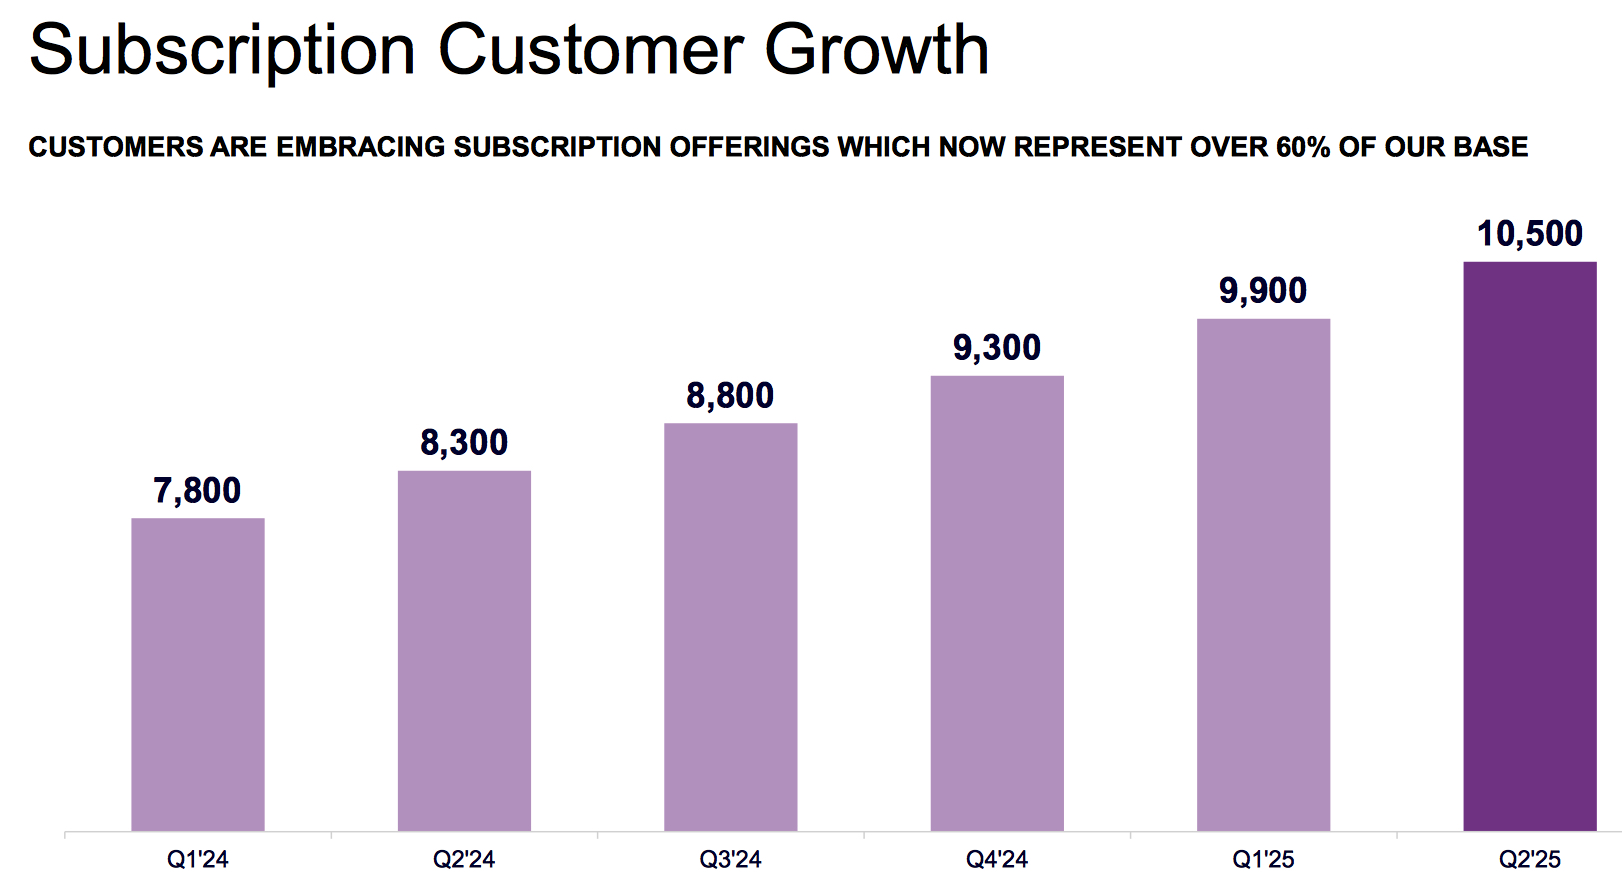
During the quarter, the firm added approximately 600 new subscription customers and have now surpassed 10,000 subscription customers WW, including over 6,000 SaaS customers.
It ended the quarter with no debt and $303 million in cash.
It expects to release an enhanced Active Directory offering shortly.
It expects total revenue to be in the range of $243 million to $247 million, with a growth of 13% at the midpoint.
It now expects total revenue growth to accelerate and be in the range of $952 million to $957 million, an increase of 14% at the midpoint.
Revenue and net income (loss) in $ million
| Fiscal Period | Revenue | Y/Y growth |
Net income (loss) |
| FY15 | 607.5 | 4% | 25.7 |
| FY16 | 595.1 | -2% | 0.1 |
| FY17 | 650.5 | 9% | 0.5 |
| FY18 | 699.4 | 8% | (61.9) |
| FY19 | 711.1 | 2% |
3.6 |
| FY20 |
670.9 |
-6% |
(5.6) |
| FY21 | 723.5 | 8% | (31.0) |
| FY22 | 769.6 | 6% | 33.6 |
| FY23 | 784.6 | 2% |
(35.8) |
| 1FQ24 | 198.2 | -3% |
12.6 |
| 2FQ24 | 201.0 | 7% |
13.0 |
| 3FQ24 | 216.8 | 11% |
17.1 |
| 4FQ24 | 223.3 | 10% | 126.1 |
| FY24 | 839.3 | 7% | 168.9 |
| 1FQ25 | 224.7 | 13% | 18.5 |
| 2FQ25 | 233.3 | 16% | 15.6 |
| 3FQ25 (estim.) | 243-247 | 12%-14% | NA |
| FY25 (estim.) | 952-957 | 13%-14% | NA |


 Subscribe to our free daily newsletter

