


Silicon Motion: Fiscal 2Q24 Financial Results
In fast motion, with sales up 11% Q/Q and 50% Y/Y
This is a Press Release edited by StorageNewsletter.com on August 2, 2024 at 2:02 pm
| (in $ million) | 2Q23 | 2Q24 | 6 mo. 23 | 6 mo. 24 |
| Revenue | 140.4 | 210.7 | 264.4 | 390.0 |
| Growth | 50% | 48% | ||
| Net income (loss) | 11.0 | 30.8 | 21.2 | 46.8 |
Business Highlights
- 2FQ24 sales increased 11% Q/Q and increased 50% Y/Y
- SSD controller sales: 2FQ24 increased 0% to 5% Q/Q and increased 25% to 30% Y/Y
- eMMC+UFS controller sales: 2FQ24 increased 25% to 30% Q/Q and increased 190% to 195% Y/Y
- SSD solutions sales: 2FQ24 increased 20% to 25% Q/Q and decreased 5% to 10% Y/Y
Silicon Motion Technology Corporation announced its financial results for the quarter ended June 30, 2024.
For 2FQ24, net sales (GAAP) increased sequentially to $210.7 million from $189.3 million in 1FQ24. Net income (GAAP) increased to $30.8 million, or $0.91 per diluted American Depositary Share of the company (ADS) (GAAP), from net income (GAAP) of $16.0 million, or $0.48 per diluted ADS (GAAP), in 1FQ24.
For 2FQ24, net income (non-GAAP) increased to $32.5 million, or $0.96 per diluted ADS (non-GAAP), from net income (non-GAAP) of $21.6 million, or $0.64 per diluted ADS (non-GAAP), in 1FQ24.
2FQ24 Review
“Our business was strong in 2FQ24, with revenue above the high-end of our guided range and gross margins at the high-end of expectations,” said Wallace Kou, president and CEO. “Our SSD controller revenue increased for the 5th consecutive quarter and strength from our eMMC and UFS business accelerated as smartphone OEMs build in anticipation for a seasonally stronger second half and modest handset industry growth this year. The first half of the year was a strong start to 2024, and we remain confident that our increasing share with flash makers and expanding product portfolio will continue to grow our business and profitability throughout this year.”
During 2FQ24, the company had $10.4 million of capital expenditures, including $6.3 million for the routine purchase of testing equipment, software, design tools and other items, and $4.1 million for building construction in Hsinchu.
Business Outlook
“Our new programs with our flash maker customers are expected to further scale throughout this year as the move to increase outsourcing continues to build the foundation for the long-term revenue and profitability growth of our business,” said Kou. “Our highly differentiated controller solutions for PCs and smartphones deliver high performance, higher density and lower cost solid state storage to enable cutting edge applications such as AI-at-the-edge. Despite the softness in the retail SSD market that is evident across the industry, we are confident that we can achieve our previous full-year outlook based on the ongoing strength of our growing NAND OEM business.”
For 3FQ24, management expects:
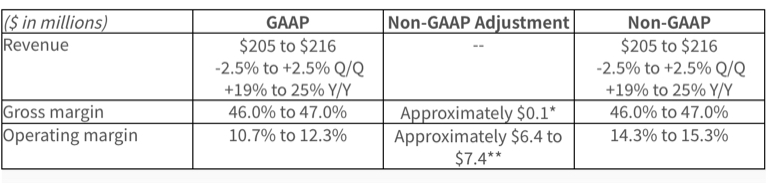
* Projected gross margin (non-GAAP) excludes $0.1 million of stock-based compensation.
** Projected operating margin (non-GAAP) excludes $6.4 million to $7.4 million of stock-based compensation and dispute related expenses.
For FY24, management expects:
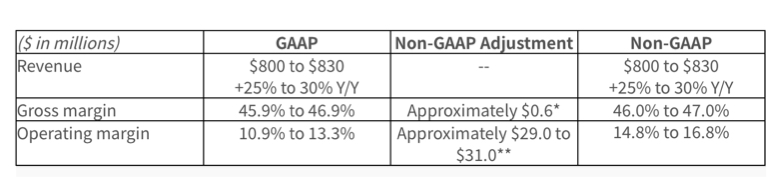
* Projected gross margin (non-GAAP) excludes $0.6 million of stock-based compensation and restructuring charge.
** Projected operating margin (non-GAAP) excludes $29.0 million to $31.0 million of stock-based compensation, dispute related expenses, restructuring charge and loss from settlement of litigation.
Comments
| Period | Revenue | Y/Y growth | Net income (loss) |
| FY22 | 945.9 | 3% | 172.5 |
| 1FQ23 | 124.1 | -49% | 10.2 |
| 2FQ23 | 140.4 | -44% | 11.0 |
| 3FQ23 | 172.3 | 31% | 11.0 |
| 4FQ23 | 200.8 | 1% | 23.5 |
| FY23 | 639.1 | -32% | 52.9 |
| 1FQ24 | 189.3 | 53% | 16.0 |
| 2FQ24 | 210.7 | 50% | 30.8 |
| 3FQ24 (estim.) | 205-216 | 19%-25% | NA |
| FY24 (estim) | 800-830 | 20-25% | NA |


 Subscribe to our free daily newsletter

