 Micron: Fiscal 3Q24 Financial Results
Revenue for storage at $1.4 billion, up 50% Q/Q
This is a Press Release edited by StorageNewsletter.com on June 28, 2024 at 2:01 pm| (in $ million) | 3Q23 | 3Q24 | 9 mo. 23 | 9 mo. 24 |
| Revenue | 3,752 | 6,811 | 11,530 | 17,361 |
| Growth | 82% | 51% | ||
| Net income (loss) | (1,896) | 332 | (4,403) | (109) |
Micron Technology, Inc. announced results for its third quarter of fiscal 2024, which ended May 30, 2024.
3FQ24 highlights
- Revenue of $6.81 billion vs. $5.82 billion for 2FQ24 and $3.75 billion for 3FQ23
- GAAP net income of $332 million, or $0.30 per diluted share
- Non-GAAP net income of $702 million, or $0.62 per diluted share
- Operating cash flow of $2.48 billion vs. $1.22 billion for 2FQ24 and $24 million for 3FQ23
“Robust AI demand and strong execution enabled Micron to drive 17% sequential revenue growth, exceeding our guidance range in 3FQ24,” said Sanjay Mehrotra, president and CEO. “We are gaining share in high-margin products like High Bandwidth Memory (HBM), and our data center SSD revenue hit a record high, demonstrating the strength of our AI product portfolio across DRAM and NAND. We are excited about the expanding AI-driven opportunities ahead, and are well positioned to deliver a substantial revenue record in fiscal 2025.”
Investments in capital expenditures, net were $2.06 billion for 3FQ24, which resulted in adjusted free cash flows of $425 million. Micron 3FQ24 with cash, marketable investments, and restricted cash of $9.22 billion.
On June 26, the board of directors declared a quarterly dividend of $0.115 per share, payable in cash on July 23, 2024, to shareholders of record as of the close of business on July 8, 2024.
Business outlook for 4FQ24:
Revenue of $7.60 billion ±$200 million
Comments
3FQ24 global revenue was $6.8 billion up 17% Q/Q and 82% Y/Y.
Revenue by business unit

Revenue for the storage business unit was $1.353 billion, up 50% Q/Q with growth across all end markets. The company achieved record data center SSD revenue, which nearly doubled sequentially.
Performance by technology
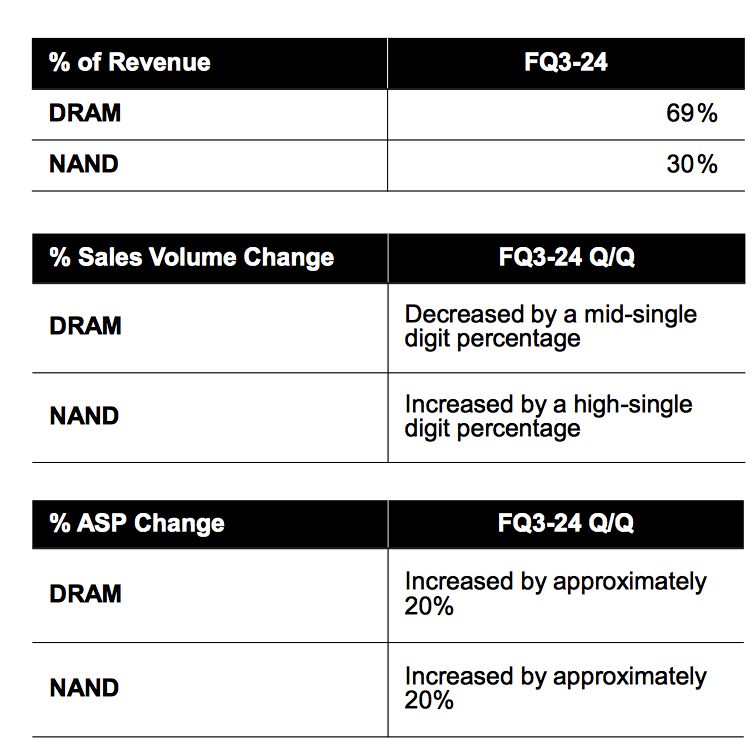
DRAM 3FQ24
- $4.7 billion, representing 69% of total revenue
- Revenue increased 13% Q/Q
- Bit shipments decreased by a mid-single digit percentage Q/Q
- ASPs increased by approximately 20% Q/Q
NAND 3FQ24
- $2.1 billion, representing 30% of total revenue
- Revenue increased 32% Q/Q
- Bit shipments increased by a high-single digit percentage Q/Q
- ASPs increased by approximately 20% Q/Q
Revenue by technology


The company said that data center SSD is in the midst of a strong demand recovery as customers have worked through their 2023 inventory. Hyperscale demand is improving, driven primarily by AI training and inference infrastructure, and supplemented by the start of a recovery of traditional compute and storage infrastructure demand. Micron is gaining share in data center SSDs as it reached new revenue and market share records in this important product category. During the quarter, it more than tripled bit shipments of its 232-layer-based 6500 30TB SSDs, which offer performance, reliability and endurance for AI data lake applications. It continued its leadership and innovation by becoming the first NAND vendor to supply 200-plus-layer QLC for the enterprise storage market.
It expects its FY24 NAND front-end cost reductions to be in the low teens percentage range.
Demand: it forecasts CY24 bit demand growth for the industry to be in the mid-teens percentage range for both DRAM and NAND. Over the medium term, it expects industry bit demand growth CAGRs of mid-teens in DRAM and high teens in NAND.
Supply: It expect CY2s4 industry supply to be below demand for both DRAM and NAND. Micron’s bit supply growth in FY24 will remains below firm's demand growth for both DRAM and NAND.
Micron will continue to exercise supply and Capex discipline, and focus on improving profitability, while maintaining its bit market share for DRAM and NAND. It continues to project that it will end FY24 with low double digit percentage less wafer capacity in both DRAM and NAND than its peak levels in FY22. It intends to use its existing inventory to drive a portion of the bit growth supporting its revenue in FY25, to enable a more optimized use of its Capex investments.
NAND revenue only
| Period | Revenue in $ million |
Q/Q or Y/Y change for FY |
% of global revenue |
| FY19 | 5,335 | NA | 23% |
| FY20 | 6,131 | 14% | 29% |
| FY21 | 7,007 | 14% | 25% |
| 1FQ22 | 1,878 | -5% | 24% |
| 2FQ22 | 1,957 | 4% | 25% |
| 3FQ22 | 2,300 | 18% | 26% |
| 4FQ22 | 1,688 | -26% | 25% |
| FY22 | 7,811 | 11% | 25% |
| 1FQ23 |
1,103 |
-35% | 27% |
| 2FQ23 | 885 | -20% |
24% |
| 3FQ23 | 1,013 | 14% |
27% |
| 4FQ23 | 1,205 | 19% |
30% |
| FY23 | 4,206 | -46% |
27% |
| 1FQ24 | 1,230 | 2% | 26% |
| 2FQ24 | 1,567 | 27% | 27% |
| 3FQ24 | 2,065 | 32% | 30% |


 Subscribe to our free daily newsletter


