 HPE: Fiscal 3Q23 Financial Results
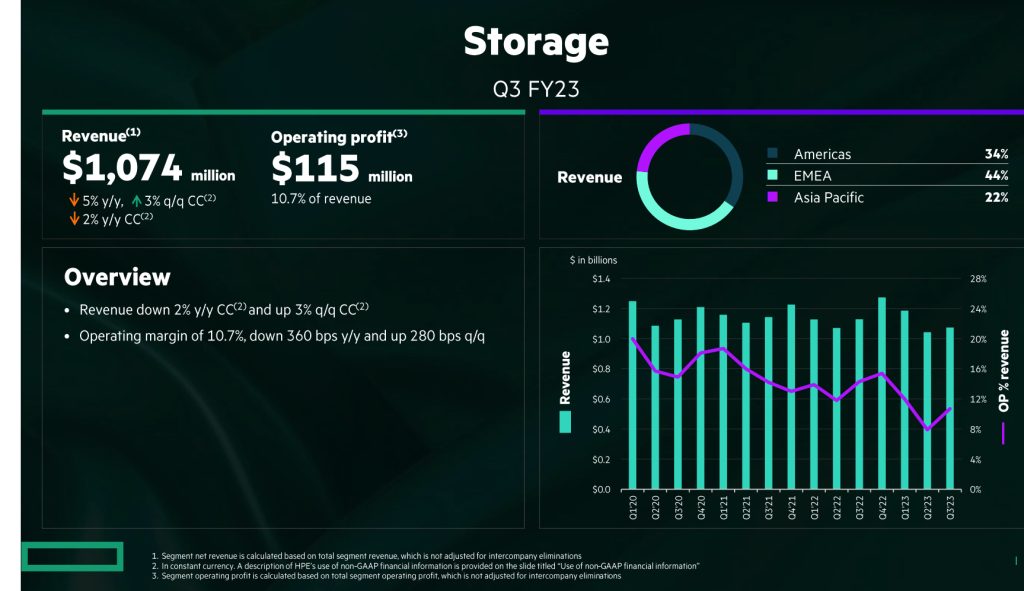
Storage up 3% Q/Q and down 5% Y/Y
This is a Press Release edited by StorageNewsletter.com on August 30, 2023 at 2:02 pm| (in $ million) | 3Q22 | 3Q23 | 9 mo. 22 | 9 mo. 23 |
| Storage revenue |
1,129 | 1,074 | 3,329 | 3,304 |
| Y/Y growth |
-5% | 0% |
||
| Earnings before taxes | 161 | 115 | 445 | 339 |
Hewlett Packard Enterprise Company announced financial results for the third quarter ended July 31, 2023.
Global revenue reached $7.0 billion in 3FQ23, up 1% from 3FQ22.

The results of firm’s storage business is not clear at all. On one side, the company stated that: “Storage fell 2% year-over-year but rose 3% sequentially.” But also on another side: “Storage revenue was $1.1 billion, down 5% from the prior-year period in actual dollars and down 2% in constant currency.” Furthermore, one year ago, the figure released was $1,152 million, meaning this time a Y/Y decrease of 7%.
For 2FQ23, storage sales were down 3% Y/Y and 11% Q/Q at $1,043 million.
Storage represents 15% of global revenue during the most recent quarter.
Demand is improving in both storage and compute segments. Storage demand was solid Y/Y with a cloud-native HPE Alletra portfolio recording triple-digit revenue growth. Storage SaaS revenue also increased double digits as the firm continues to intentionally drive more of Alletra own IP through HPE GreenLake.
Alletra revenue grew triple digits in 3FQ23 for the 5th consecutive quarter. It is now one of company’s higher revenue products and thus growth rates may normalize. This product is shifting a mix within storage to higher-margin, software-intensive revenue and is a key driver of firm’s ARR growth. The company continue to invest in R&D and its owned IP products in this business unit, such as its new file-as-a-service and Alletra MP offerings. 3FQ23 operating margin of 10.7% is down 360 basis points Y/Y as the vendor transitions to Alletra that includes a meaningful component of ratable revenue, which pushes revenue recognition out into future periods.
The fastest-growing components within ARR year-over-year are storage and edge.
Revenue for HPE storage since FY17
(in $ million)
| Fiscal quarter |
Revenue |
Q/Q growth |
Y/Y growth |
| FY17 | 3,280 | 3% |
|
| FY18 |
3,706 |
13% | |
| FY19 |
3,609 | -3% | |
| FY20 | 4,681 | -10% | |
| FY21 | 4,763 | 2% | |
| 1FQ22 | 1,156 | -8% | |
| 2FQ22 | 1,098 | -3% |
|
| 3FQ22 | 1,152 | 5% |
|
| 4FQ22 | 1,305 | 4% |
|
| FY22 | 4,711 | -1% | |
| 1FQ23 | 1,187 | 5% |
|
| 2FQ23 | 1,043 | -11% | |
| 3FQ23 | 1,074 | 3% |


 Subscribe to our free daily newsletter

