 Nutanix: Fiscal 1Q23 Financial Results
Positive quarterly non-GAAP operating income for first time for company that could be acquired by HPE
This is a Press Release edited by StorageNewsletter.com on December 5, 2022 at 2:02 pm| (in $ million) | 1Q22 | 1Q23 | Growth |
| Revenue |
378.5 | 443.6 | 17% |
| Net income (loss) | (419.9) | (99.1) |
Nutanix, Inc. announced financial results for its first quarter ended October 31, 2022.
“We delivered a solid first quarter financial performance against an uncertain macro backdrop, reflecting the value our customers see in the Nutanix Cloud Platform and the strength of our subscription-based business model,” said Rajiv Ramaswami, president and CEO. “We also made important progress towards realizing our hybrid multicloud vision with the general availability of Nutanix Cloud Clusters (NC2) on Microsoft Azure and enhancements to our platform to accelerate the adoption of Kubernetes at scale in the enterprise.”
“Our first quarter results reflect continued progress on our subscription-based business model with 27% Y/Y ACV billings growth and achievement of positive quarterly non-GAAP operating income for the first time,” said Rukmini Sivaraman, CFO. “We continue to see good execution on our building base of subscription renewals and remain focused on driving towards sustainable, profitable growth.”
1FQ23 Financial Summary

2FQ23 Outlook

FY23 Outlook

Comments

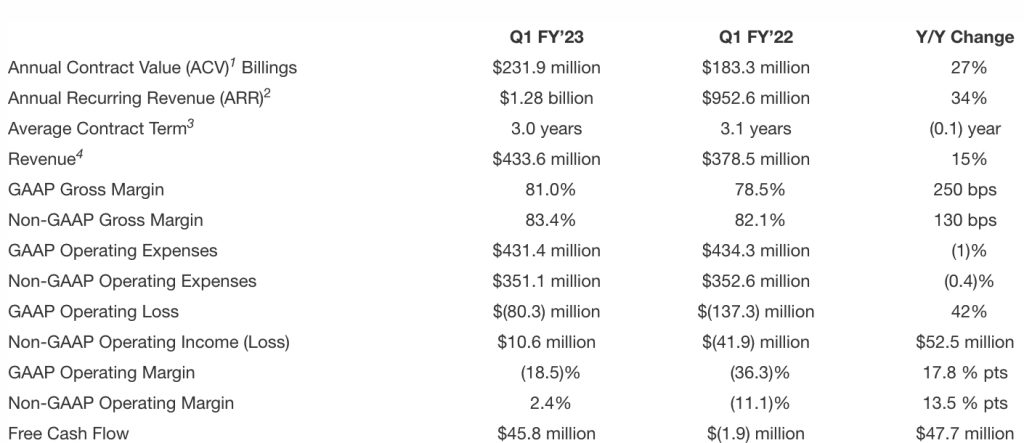
Quarterly revenue reached $443.6 million, up 17% Y/Y and 15% Q/Q, largely beating guidance ($410-415 million).
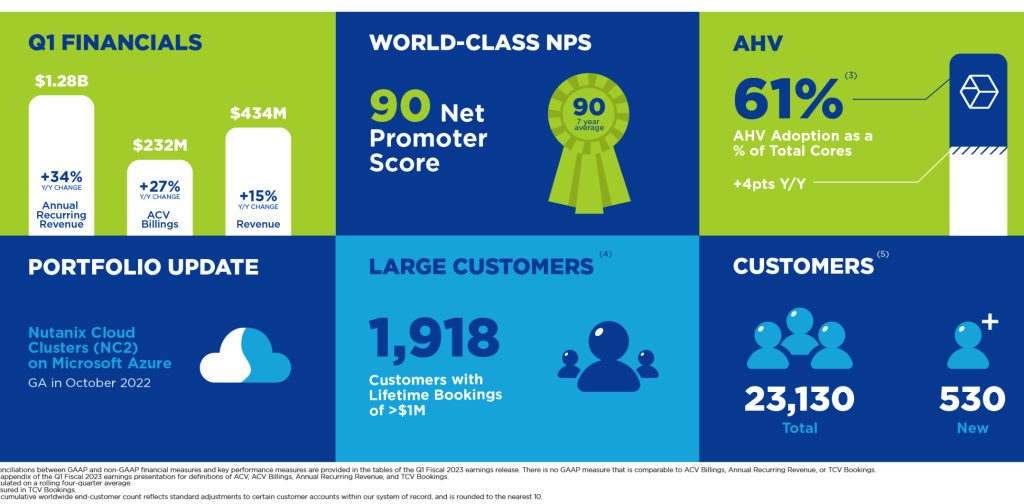
ACV billings in 1FQ23 was $232 million, higher than guidance of $210 million to $215 million and representing a Y/Y growth of 27%. A majority of that growth came from growth in renewals billings.
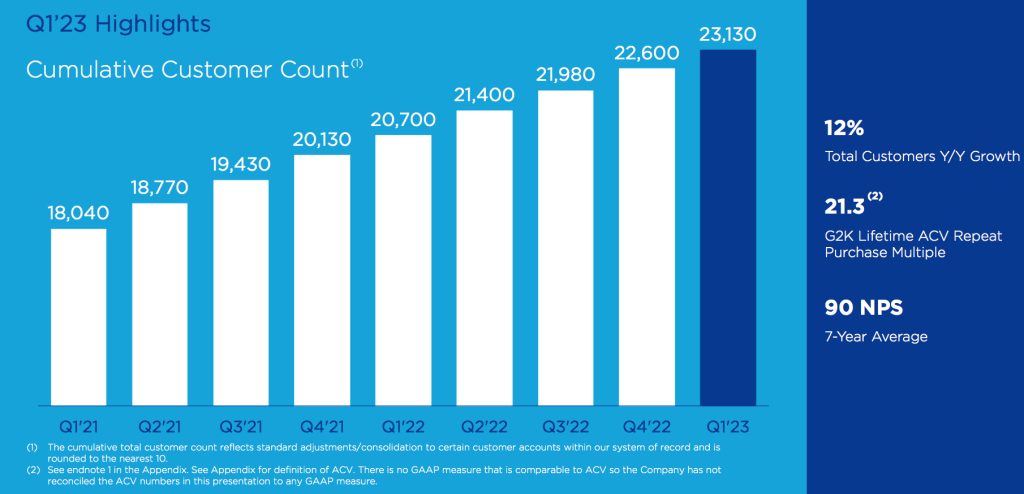
The ARR at the end of the quarter was $1.281 billion, a Y/Y growth of 34%. New logo additions were about 530 in 1FQ23. Contract durations decreased Q/Q to 3 years as expected, partly due to a seasonally higher mix of U.S. federal business that typically has shorter contract durations. The percentage of orders with future start dates continue to be a key assumption in firm's 1FQ23 guidance. It came in lower than it was in 4FQ22 and slightly below expectations.
Customer growth

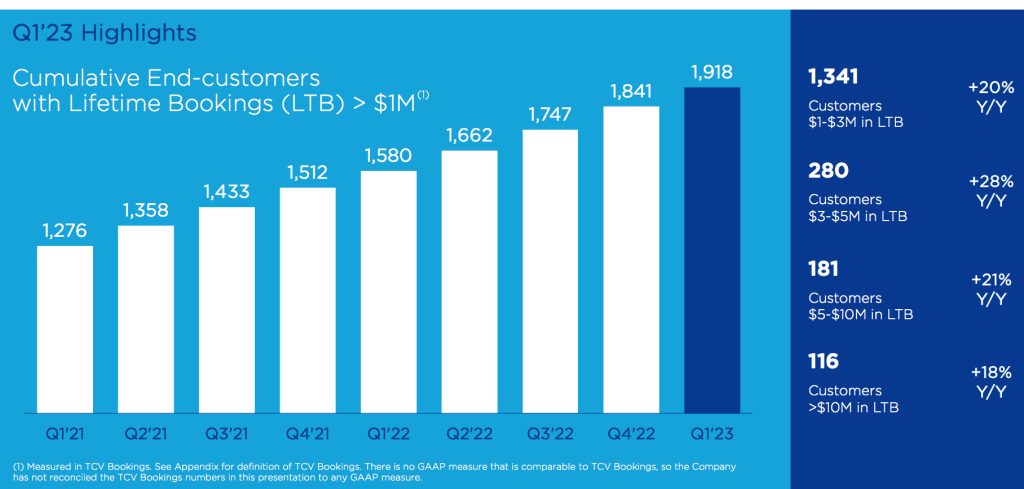
Over $1 million customer growth

ACV billings and revenue were above guidance, driven by strong continued performance of renewals business.
The firm ended 1FQ23 with cash, cash equivalents and short-term investments of $1.388 billion, up slightly from $1.324 billion in 4FQ22.
Its first quarter is typically a stronger one for federal business.
Guidance
Revenue of $460 million to $470 million for 2FQ23, a yearly growth of 13% at the midpoint. It includes approximately $10 million of revenue benefit from the decline in percentage of orders with future start dates over the last few months. Revenue guidance remains unchanged for FY23 at $1.77 billion to $1.78 billion, up 12% to 13% compared to FY22.
Acquisition by HPE?
But the main event for Nutanix is that there are several rumors of its acquisition by HPE (the names of Cisco and Google were also cited). It will be very interesting for HPE to get the king of HCI with annual sales to reach more than $1.7 billion in FY23, but huge losses since its inception (total of more than $5.5 billion and never profitable since 10 years) but with lowest loss since a long time ($99 million) in the most recent quarter, even if HPE acquired Simplivity in 2017 in same business but much less successful. And note the sofware vendor offers HPE servers with its solutions. The price seems to be the problem as Nutanix is capitalized at as much as around $6.5 billion.
Revenue and loss of Nutanix
(in $ million)
| FY ended in July |
Revenue | Loss |
| 2012 | 6.6 | 14.0 |
| 2013 | 30.5 | 44.7 |
| 2014 | 127.1 | 84.0 |
| 2015 | 241.4 | 126.1 |
| 2016 | 444.9 | 168.5 |
| 2017 | 845.9 | 379.6 |
| 2018 | 1155 | 297.2 |
| 2019 | 1136 | 621.2 |
| 2020 | 1308 | 872.9 |
| 2021 |
1,394 | 1,034 |
| 1FQ22 |
378.5 | 419.9 |
| 2FQ22 |
413.1 | 115.1 |
| 3FQ22 |
403.7 | 111.6 |
| 4FQ22 |
385.5 | 151.0 |
| FY22 |
1,581 | 797.5 |
| 1FQ23 |
443.6 | 99.1 |
| 2FQ23 (estim.) |
460-470 | NA |
| FY23 (estim.) |
1,770-1,780 | NA |
| Total | ∼5,000 |
($238 million IPO in 2016)


 Subscribe to our free daily newsletter


