333 Million SSDs Shipped in 2020 Corresponding to 207EB
Up 21% and 50% Y/Y respectively
This is a Press Release edited by StorageNewsletter.com on February 15, 2021 at 2:28 pmThis is an Executive Summary of Trendfocus, Inc.‘s NAND/SSD Information Service 4Q20 Quarterly Update published on February 10, 2020.
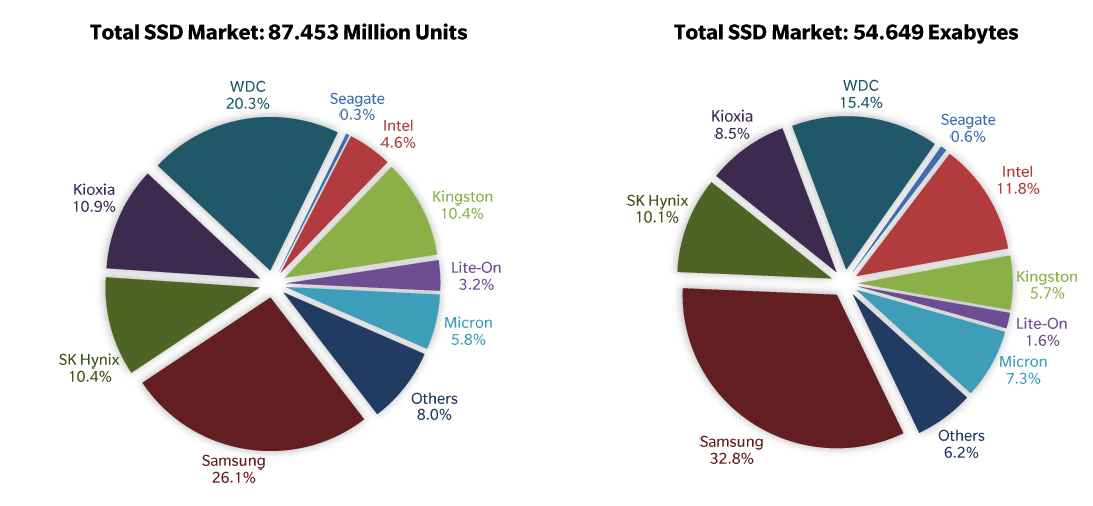
4CQ20 SSDs Rise 6% to 87 Million Units, 1% to 55EB Q/Q – 2020 SSD Capacity Tops 207EB
Strong PC and channel SSD rise offsets sequential enterprise and cloud reductions due to inventory and capacity digestion
Client DFF capacity shipments jump 18% Q/Q to 9.41EB, outpacing other segments, while client M.2 increased 11% over the same period to 25.11EB
All enterprise SSD interfaces posted sequential declines in the quarter, led by a 31% unit and 34% capacity shipment plunge for SAS SSDs Q/Q.
Enterprise SATA SSDs shipment declines reflected continued channel markets softness due to elevated inventories and reduced demand exiting the year.
With majority of unit volumes and capacity utilized by the data center market, enterprise PCIe SSDs fell after 3 straight record quarters as hyperscale companies entered what expects to be a short digestion phase.
Total NAND capacity shipped increased 12% Q/Q to 124.68EB, with SSDs consuming 45% of all NAND shipped, or 56.48EB, followed by mobile applications at 31% share, totaling 56.48EB.
4CQ20 SSD Market Share by Supplier, Units in Million, Exabytes

Comments
In 2020 were shipped 28% more SSDs than HDDs but for 5 times less total capacity, as currently mechanical drives are chosen for their much better price/GB for high capacities than solid-state units now at about the same price for small capacities.
2020 Market for HDD and SSDs
| Units shipped in million | Y/Y growth | Exabytes | Y/Y growth | |
| SSDs | 333.120 | +20.8% | 207.39 | +50.4% |
| HDDs | 259.810 | -18% | 1.018.32 | +13% |
(Source: Trendfocus)


 Subscribe to our free daily newsletter


