Cloud IT Infrastructure Spending Grew 12% in 4Q19, Led by Dell and HPE and Cisco
Storage platforms saw fastest Y/Y growth at 15% reaching $6.6 billion.
This is a Press Release edited by StorageNewsletter.com on April 6, 2020 at 2:26 pmAccording to the IDC Corp.‘s Worldwide Quarterly Cloud IT Infrastructure Tracker, total end-user spending* on IT infrastructure products (server, enterprise storage, and Ethernet switch) for cloud environments, including public and private cloud, recovered in 4Q19 after two consecutive quarters of decline.
The 12.4% Y/Y growth in 4Q19 yielded $19.4 billion in spending. This quarter results also brought the full year into positive territory with annual growth of 2.1% and total spending of $66.8 billion for 2019.
Meanwhile, the overall IT infrastructure market continued to struggle after its strong performance in 2018, up 3.3% to $38.1 billion in 4Q19 but declining 1.1% to $134.4 billion for the full year.
Non-cloud IT infrastructure fell 4.6% to $18.7 billion for 4Q19 and declined 4.1% to $67.7 billion for the year 2019.
4Q19 Cloud IT Infrastructure Market Results
In 4Q19, growth in spending on cloud IT infrastructure was driven by the public cloud segment, which grew 14.5% Y/Y to $13.3 billion; private cloud grew 8.2% to $6.1 billion.
As the overall segment is generally trending up, it tends to be more volatile at the quarterly level as a significant part of the public cloud IT segment is represented by a few hyperscale service providers. After a weaker middle part of the year, public cloud ended 2019 barely up 0.1% to $45.2 billion. Private cloud grew in 2019 by 6.6% to $21.6 billion.
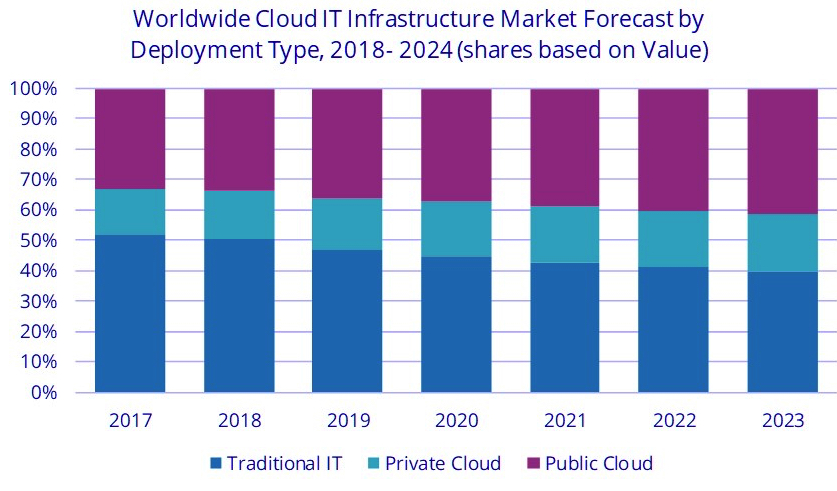
As investments in cloud IT infrastructure continue to increase, with some swings up and down in the quarterly intervals, the IT infrastructure industry is approaching the point where spending on cloud IT infrastructure consistently surpasses spending on non-cloud IT infrastructure. 4Q19 marked the third consecutive quarter of cloud IT leadership with the annual share just slightly below the midpoint (49.7%). From here on out, it is expected that cloud IT infrastructure will stay above 50% of the IT infrastructure market at both the quarterly and annual levels, reaching 60.5% annually in 2024.
Across the three IT infrastructure technology domains, storage platforms saw the fastest Y/Y growth in 4Q19 at 15.1% with spending reaching $6.6 billion. Compute platforms grew 14.5% year over year with $10.8 billion in spending while Ethernet switches declined 3.9% to $2.0 billion. For 2019, Ethernet switches led with Y/Y growth of 5.0% and $8.2 billion in spending, followed by storage platforms with 1.9% growth and spending of $23.1 billion, and compute platforms with growth of 1.5% and spending of $35.5 billion.
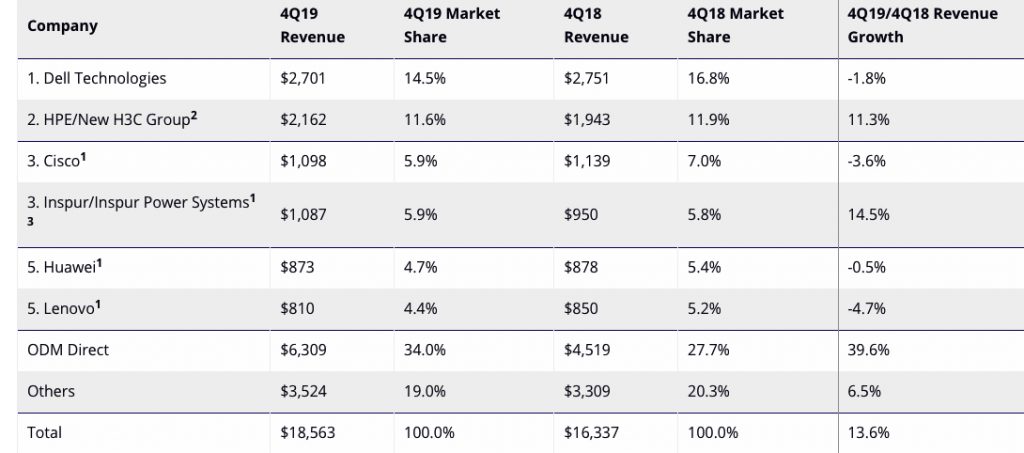
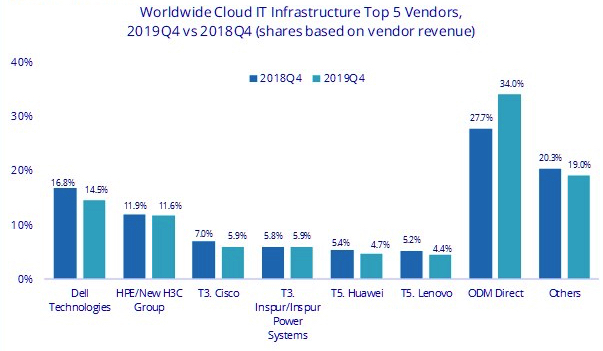
Top Companies, WW Cloud IT Infrastructure Vendor Revenue*, Market Share, and Y/Y Growth, 4Q19
(revenue in $million)

Table Notes:
1 There is a statistical tie in the WW cloud IT infrastructure market when there is a difference of 1% or less in the vendor revenue shares among 2 or more vendors.
2 Due to the existing joint venture between HPE and the New H3C Group, IDC reports external market share on a global level for HPE as HPE/New H3C Group starting from 2Q16.
3 Due to the existing joint venture between IBM and Inspur, IDC reports external market share on a global level for Inspur and Inspur Power Systems as Inspur/Inspur Power Systems starting from 3Q18.

4Q19 Cloud IT Infrastructure Market Forecast
The forecast for 2020, after taking into consideration the repercussions of the COVID-19 pandemic and its ensuing economic crisis, is for $69.2 billion in cloud IT infrastructure spending*, a 3.6% predicted annual increase over 2019. Non-cloud IT infrastructure spending is expected to decline 9.2% to $61.4 billion in 2020. Together, overall IT infrastructure spending is expected to decline 2.9% to 130.6 billion.
The COVID-19 pandemic represents a severe threat to global growth. Prior to the outbreak the expected global real GDP growth was to be lackluster 2.3% (at market exchange rates) in 2020. The emergence of the epidemic in China is a game changer and the expected growth for 2020 is now -0.2%, the slowest rate since the global financial crisis. The negative effect on growth will come via both demand and supply channels. On one hand, quarantine measures, illness, and negative consumer and business sentiment will suppress demand in specific areas, while certain pockets of demand will surface, such as cloud platforms for communication and collaboration workloads. At the same time, closure of some factories and disruption to supply chains will create supply bottlenecks. It is expected that these effects to be distributed unevenly across the market landscape.
“While the beginning of 2020 was marked by supply chain issues that should be resolved before the end of the second quarter, the negative economic impact will hit enterprise customers’ CAPEX spending,” said Kuba Stolarski, research director, infrastructure systems, platforms and technologies. “As enterprise IT budgets tighten through the year, public cloud will see an increase in demand for services. This increase will come in part from the surge of work-from-home employees using online collaboration tools, but also from workload migration to public cloud as enterprises seek ways to save money for the current year. Once the coast is clear of coronavirus, IDC expects some of this new cloud service demand to remain sticky going forward.”
New 5-year forecast predicts cloud IT infrastructure spending* will reach $100.1 billion in 2024 with a CAGR of 8.4%. Non-cloud IT infrastructure spending will decline slightly to $65.3 billion with a -0.7% CAGR. Total IT infrastructure is forecast to grow at a 4.2% CAGR and produce $165.4 billion in spending in 2024.

* Revenue vs. spending references
Taxonomy notes
IDC measures market shares by vendor revenue, which excludes channel margin. Total end user spending includes channel spending and is used in the total market sizing and forecasting described in this press release.
Cloud services are defined more formally through a checklist of key attributes that an offering must manifest to end users of the service. Public cloud services are shared among unrelated enterprises and consumers; open to a largely unrestricted universe of potential users; and designed for a market, not a single enterprise. The public cloud market includes variety of services designed to extend or, in some cases, replace IT infrastructure deployed in corporate datacenters. It also includes content services delivered by a group of suppliers called value added content providers (VACP). Private cloud services are shared within a single enterprise or an extended enterprise with restrictions on access and level of resource dedication and defined/controlled by the enterprise (and beyond the control available in public cloud offerings); can be onsite or offsite; and can be managed by a third-party or in-house staff. In private cloud that is managed by in-house staff, vendors (cloud service providers) are equivalent to the IT departments/shared service departments within enterprises/groups. In this utilization model, where standardized services are jointly used within the enterprise/group, business departments, offices, and employees are the service users.
IDC defines compute platforms as compute intensive servers. Storage platforms includes storage intensive servers as well as external storage and storage expansion (JBOD) systems. Storage intensive servers are defined based on high storage media density. Servers with low storage density are defined as compute intensive systems. Storage platforms does not include internal storage media from compute intensive servers. There is no overlap in revenue between compute platforms and storage platforms, in contrast with IDC’s Server Tracker and Enterprise Storage Systems Tracker, which include overlaps in portions of revenue associated with server-based storage.
Read also:
Spending on Public and Private Cloud IT Infrastructure Totaled $66.1 Billion in 2018, Up 4.5% Estimated in 2019 – IDC
Led by Dell, HPE, Cisco, Inspur and Huawei in 4Q18
April 5, 2019 | Press Release


 Subscribe to our free daily newsletter


