Enterprise SSD Debug and Failure Analysis
By Andrei Konan, senior staff firmware engineer, SK Hynix Memory Solutions America
This is a Press Release edited by StorageNewsletter.com on August 29, 2019 at 2:06 pm Andrei Konan, senior staff firmware engineer, have spent years debugging SSDs, SK Hynix Memory Solutions America, Inc., wrote this article on July 28, 2019.
Enterprise SSD Debug and Failure Analysis
It covers the following topics:
- What is so specific about enterprise SSD failure analysis?
- Overview of typical failure symptoms and issue root causes
- Common debug solutions like
- Crash Dump
- JTAG Abstraction
- Event Tracking
- Vendor unique interface for enterprise SSDs
- Incident package
- Summary with my recommendations
What is so specific about enterprise SSD failure analysis?
As a first item I’m highlighting Platform Diversity. Enterprise storage server can be very complex construction just in terms of SSD connection. Like motherboard, next PCIe switch, next cables, enclosures, adapters and finally SSD. And I’m not even saying about software stack complexity on the host side. All this adds a lot of unknown variables during failure analysis. Issue can simply come from the one of the components in this long chain or SSD itself. You need to triage and confirm.
Second item is a testing duration. Internal and customer qualifications last for at least a year. And the drive volume under the test is significant. It can be more than couple of thousands in one product gen. Whenever you fail – it is almost always qualification restart and big loss for the SSD vendor. In such case the precision of failure analysis, fix application and validation should be done at the top level and guarantee that this type of issues will be eliminated in the next half of a year after restarting.
Let’s move to the next item. As I mentioned before field failure during qualification or mass production can mean big losses for both customer and vendor. That is why failure analysis should be done quickly and diligently. As a rule, field customer issues are immediately escalated to the top management on both sides. So, the reaction in terms of root cause finding should be appropriate.
The last item is about customer environment. More and more of our customers prefer real environment to the synthetic testing. Though both methods co-exist, for cloud companies for example best way of testing is just to install rack of new drives into the cloud system and verify them in the real battlefield. It puts a lot of restrictions for the failure analysis as now SSDs are storing real confidential user data. SSD vendors should assume that they will not be even allowed to enter the data centers. It makes the work more complicated.
How do SSDs typically fail and what do our customers observe and ask?
• Drive is not recognized. Q: It is dropped out from the system after we started the test, what happened?
• Command timeout. Q: Write command timeouts for 5s and still there is no response after timeout, what is wrong?
• Performance degradation. Q: How can you explain QoS consistency drop in 4K random read workload after 3 months of testing?
• SMART inconsistency. Q: We wrote to the drive 10TB of data, why SMART is indicating 11TB? Q: Why grown NAND defect block count is not zero, we just received the drives last week?
• Boot-up latency. Q: After power cycle drive is not ready to accept IO commands within 10s. can you explain this?
• Link issues. Q: Why the drive is detected only as Gen2x2, but not Gen3x4?
What are the typical root causes?
• Power loss recovery bug. A: Firmware was not able to store data after power loss signal while operating on POSCAP energy
• NAND malfunction. A: Entire NAND die does not respond A: Single NAND physical block is suddenly fully broken – cannot read and decode any data from it
• DRAM issues. A: Too many bitflips that DRAM ECC engine cannot recover A: DRAM is not operating stably in high ambient temperature
• Wrong init sequence. A: Firmware allowed IO command to go through, while mapping table was not yet initialized
• SMART update miss: SMART data was not saved during power loss. Firmware lost latest counters update
• Overheat. A: Thermal throttling unexpectedly kicked in and reached critical level forcing drive to shut down
• Broken POSCAP. A: Regular POSCAP health check failed. Capacitors are no longer capable of keeping drive alive for the short period of time when power loss happens.
These are most typical cases. There are many more others. OK, what to do in case of failure?
Crash Dump
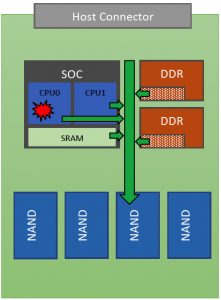
Crash Dump means hard failure. Firmware cannot continue SSD operation due to either internal state inconsistency or unexpected response, behavior from NAND, DRAM. Trigger point is asserted condition. Usually there is a big discussion inside SSD team whether to enable asserts in production or not. My opinion – asserts must be enabled in production with some clean-up. It is better to catch the failure right on time with all details rather than debug some unknown consequences. Firmware is not ideal, bugs happen, we should accept it.
What do we do in assert condition and what data do we dump? Typically, SSD SOC has multiple CPUs. Assert can happen in one of them. The rest should be frozen, and single master CPU dumps all the debug data to NAND. Main items to dump are CPU stacks, critical memory regions in TCM/SRAM/DRAM and SOC registers state. As soon as dump is completed to the NAND, we have only one option to reboot internally. From host perspective it is quite unexpected that drive reboots internally, resets the link and takes long time to recover itself, but it is much better than hard hang with no response.
JTAG abstraction over PCIe
Sounds weird, doesn’t it? In case firmware engineer wants to debug physical SSD he/she needs PC, JTAG software, JTAG equipment and some connecting cables/adapters to reach the SOC JTAG interface. It is orange path on the figure below.
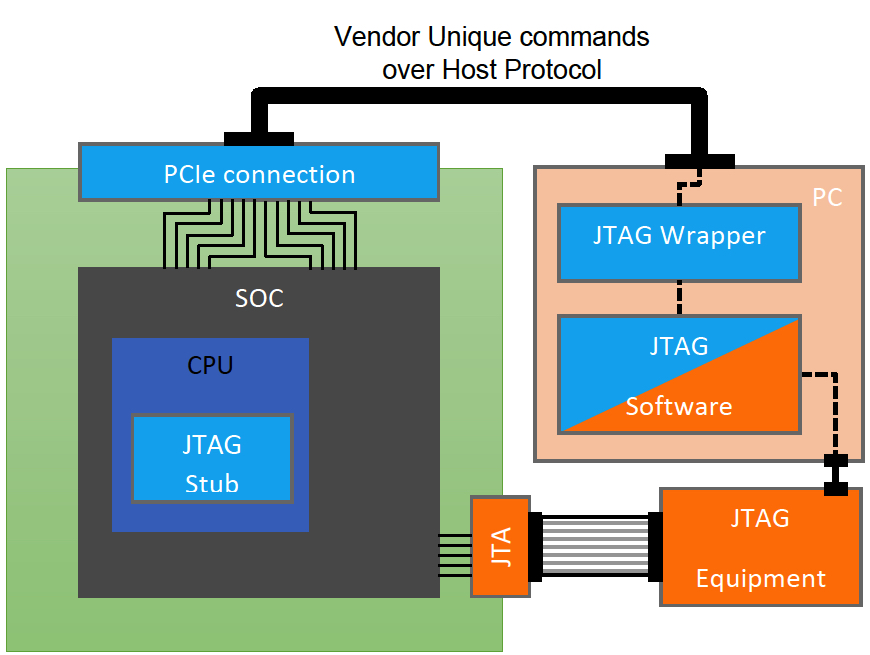
What we typically do using JTAG? Frankly speaking, very simple things: Memory/Register Read and Write, View Stack Frames, Setting and Catching breakpoints. That is it. We may have a lot of custom plug-ins, visualization, etc. on top level. But at the JTAG low level it is simply memory read and write requests.
You may have reasonable question: JTAG solution already seems to be enough and what is the reason to invent something new? Basically, scaling JTAG equipment during massive sample testing is expensive. Imagine SSD vendor is running internal qualification of thousands drives far away from R&D center. Whenever something special fails – Firmware engineer needs JTAG connection to debug failed unit. Having JTAG equipment for each drive under test it is tremendous investment. Although one-time purchase looks affordable, in the end license support, update, scalability will increase initial costs couple of times. And finally, the majority of equipment will be idle, we just cannot predict which Drive will fail, thus need to have the ability to debug with JTAG any failed drive.
Considering that JTAG protocol logic is simple, why not to re-route these requests from JTAG software for example through the vendor unique protocol over Host interface (NVMe, SATA, SAS)? See figure above for blue path on figure. All we will need is some stub in firmware code that will process, handle and respond to the JTAG commands. It is quite simple. See the blue path in the picture. The same JTAG software, simple wrapper to reroute JTAG protocol and firmware stubs. For sure there are limitations, like host protocol operation is broken – we cannot use it. But in most of cases this solution is very cheap and effective. One more important item – it is not for production, just internal usage. SSD security does not allow any physical or virtual JTAG connection support in mass production.
Event Tracking
In the field the fact of failure itself is not fully enough to understand the root cause. For example, NAND read command consistently fails with undecodable data. There can be multiple reasons for this. To narrow down we need more information, like how many times we retried the read operation, what recovery algorithms we applied, were there any other issues in the same NAND channel and so on? Sequence of events does matter a lot as well.
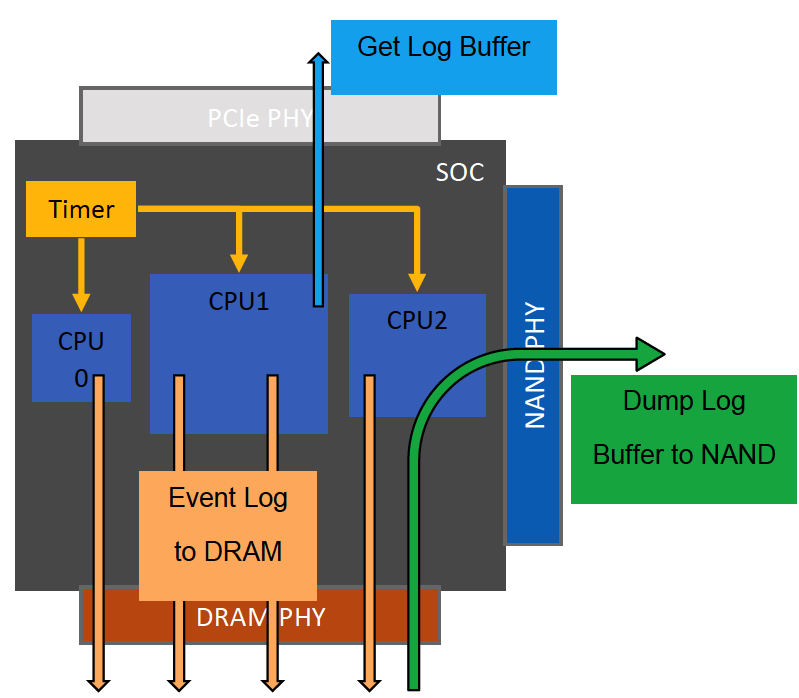
Typically, in case of failure we are dealing with some rear event and its buggy consequences. Event like power on recovery, link reset, NAND grown defect, overheat, resource starvation. These events are not very timing critical. Why not to spend tens of microseconds to log them? For sure if we are running I/O and everything goes smoothly – there is no need to log, no overhead. I hear regularly – logging will affect throughput and latency; it will eat the NAND space to store logs. My answer – it is OK to log corner case events with small meta information attached even in production. Critical path firmware code is not affected unless we encounter the problem.
SK Hynix is working in the patent field for this approach for the last couple of years. It is published (US20190129774A1) and non-provisional application is under review. I’ve tried to put basic concept in figure above. SSD SOC has multiple CPUs sharing the same timer. It is important that all events from multiple CPUs are synchronized. Whenever corner case event happens, we log it to the DRAM buffer. As soon as buffer is getting full or some event like sudden power loss happens – we flush tracking buffer to the NAND. Using Vendor Unique protocol over host interface we can retrieve all events with timestamps and small metadata at any point of time. Pretty straight forward but appeared to be very effective.
Vendor Unique Protocol
I have already mentioned Vendor Unique protocol couple of times in my presentation. In the next figure, I would like to describe it a little bit more. Vendor Unique protocol is implemented of the host interface (SATA, SAS, NVMe) and it is very custom for each vendor. It opens rich debug functionality of the SSD for 2 main purposes: (1) to retrieve internal debug data, (2) in-house testing assistance to boost some corner cases in firmware. That is why protocol should be gently secured in production, not just with simple text password but with sessions and certificates. Or simply disabled in production. We have host protocol alternatives like Telemetry Logs. It means in the industry we do understand the importance doing failure analysis on all levels.
Incident Package
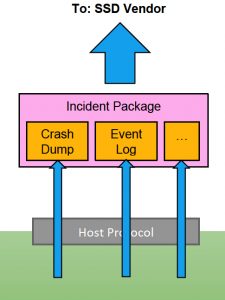
We have already discussed debug solutions we can use in case of failure. The last item left is to pack all the debug info into the Incident Package and send out to the SSD vendor for review and analysis. Incident package usually contains maximal possible debug info that we can extract from the drive. As we have already failed, we can allow our tools to spend some time extracting as much debug info as possible. More and more often customers are requiring incident package to be human readable. They want to review all the information that is leaving data centers. In such case drive should be self-descriptive in order to generate human readable logs. Nobody will wait for a month, days or even hours for the incident package to be generated or re-generated in case of mistake. Typically, you have 20 to 40 minutes before drive is decommissioned. And as I mentioned before about complexity of the storage servers in terms of just physical connections; tool generating incident packages should be ready for any OS, driver version and connection type.
Summary
In my opinion debug infrastructure support is a priority task for the project team. It is of the same importance as top performance and best in class latency. It is completely fine to enable debug features in production. They can be implemented in such a way that they have minimal impact on SSD critical path operation. Having good debug tools will make you fast in failure analysis that is greatly appreciated. The last item is more of a recommendation. No matter what type of failure occurred – keep the SSD alive and recognizable even if it takes minutes or couple of internal SSD resets. There is nothing worse than brick SSD at customer side that you cannot debug.


 Subscribe to our free daily newsletter

