Seagate: Fiscal 3Q19 Financial Results
Revenue down 15% Q/Q but next quarter supposed to be at same level
This is a Press Release edited by StorageNewsletter.com on May 2, 2019 at 2:22 pm| (in $ million) | 3Q18 | 3Q19 | 9 mo. 18 | 9 mo. 19 |
| Revenue | 2,803 | 2,313 | 8,349 | 8,019 |
| Growth | -17% | -4% | ||
| Net income (loss) | 381 | 195 | 721 | 1,029 |
Seagate Technology plc reported financial results for its fiscal third quarter ending March 29, 2019.
“Seagate executed very well in the third quarter while navigating near-term demand head-winds. Our focus on operational efficiency and expense discipline drove better-than-expected EPS and free cash flow generation,” said Dave Mosley, CEO. “We began shipping the industry’s first 16TB high capacity drives in the fiscal third quarter and expect to ramp high volume production in the second half calendar 2019. The Data Age digital transformation has given rise to many new applications including ML, autonomous vehicles, and Smart Cities, which all rely on faster access to an increasing amount of data. These trends are creating significant opportunities for our mass storage solutions and we are successfully executing our technology roadmap to address growing demand.”
In the third quarter, the company generated $438 million in cash flow from operations and $291 million in free cash flow. Year to date, the company has generated $1.3 billion in cash flow from operations and $862 million in free cash flow. Balance sheet is healthy and during the third quarter, the company paid cash dividends of $178 million and repurchased 7.2 million ordinary shares for $327 million. Cash and cash equivalents totaled $1.4 billion at the end of the quarter. There were 277 million ordinary shares issued and outstanding as of the end of the quarter.
Quarterly Cash Dividend
The board of directors of the company declared a quarterly cash dividend of $0.63 per share, which will be payable on July 3, 2019 to shareholders of record as of the close of business on June 19, 2019.
Guidance for 4FQ19:
• Revenue of approximately $2.32 billion, plus or minus 5%
• Non-GAAP diluted earnings per share of approximately $0.83, plus or minus 5%
Comments
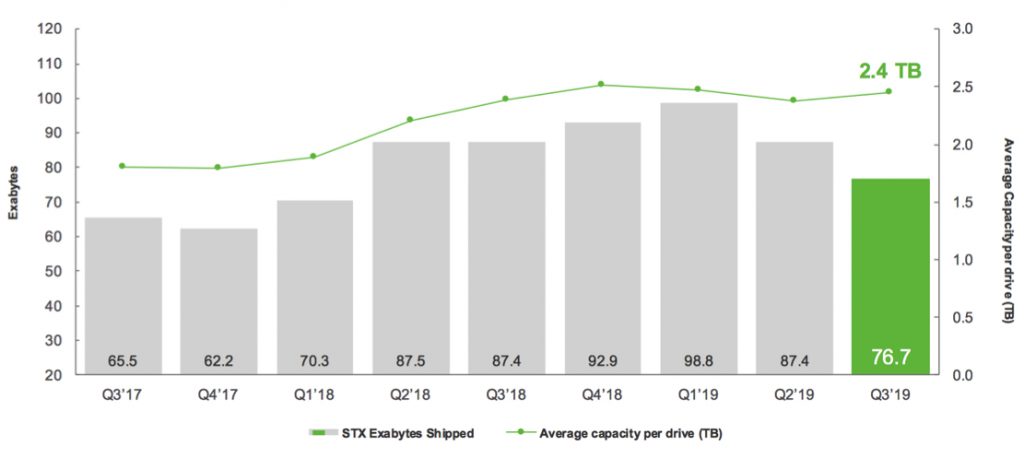
Sequentially, March quarter revenue was $2.31 billion down 15%, and total shipment of 77EB down 12% and declining constantly each quarter since since one year.
These results reflect the impact of softer demand from cloud service providers in advance of company's transition to 16TB nearline drives as well as the ongoing global macro concerns and typical seasonality, according to Seagate.
Revenue for enterprise market
It includes nearline and mission-critical HDDs and represented 39% of March quarter revenue, flat as a percent of revenue from the December quarter. It corresponds to the shipping approximately 33EB, down 10% Q/Q. The vast majority of the exabyte shipments were into the nearline market. Exabyte shipment for cloud customers were up Q/Q, which partially offset the decline in shipments to OEMs. The average capacity for nearline drives hit a new record of 7.2TB, up 11% over the prior quarter. 12TB nearline drive remained the highest-selling enterprise product in the March quarter.
Revenue for the non-compute market
It contributed 32% of the quarter revenue compared to 31% in the former one. It includes sales of surveillance, gaming, NAS, DVR, and consumer applications. Sales for data breach application including gaming NAS and DVR grew sequentially, which partially offset the micro headwind and seasonal trend impacting the surveillance and consumer market respectively. Exabyte shipments for edge non-compute platform was 29EB and down 10% Q/Q, while, average capacity per drive remain flat at 2.4TB.
Revenue from the edge compute market
It includes desktop and notebook HDDs and represented 20% of total revenue compared to 21% in the December quarter. These results, as a typical seasonality, combined with ongoing CPU shortages. Exabyte shipments for edge compute platforms were nearly 15EB down 21% Q/Q with steeper than seasonal decline from notebook and desktop PCs. Non-hard disk drive business including SSD and cloud system solution made up the remaining 8% of March quarter revenue down 16% from the December quarter.
HDD Exabytes Shipped and Average Capacity per Drive
Click to enlarge

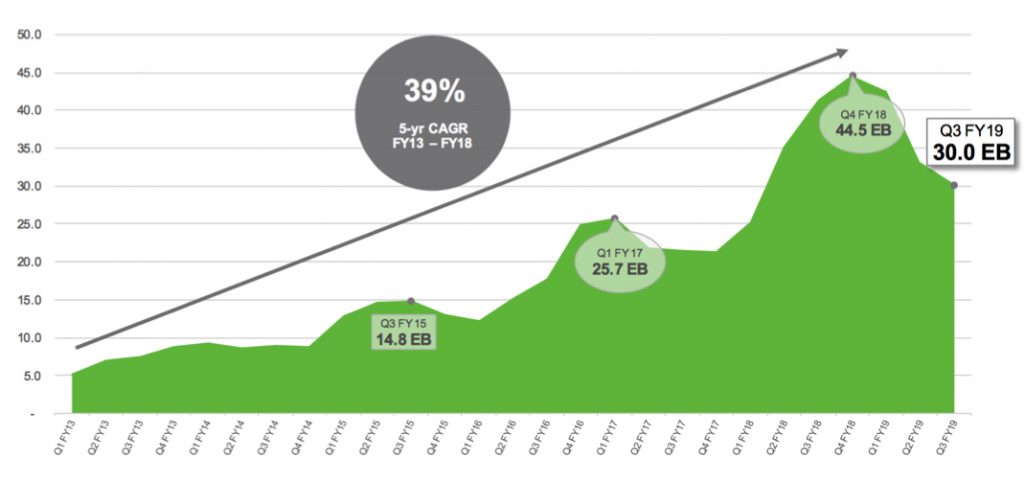
Nearline Demand Trend
Click to enlarge

In nearline products, demand is attributed to cloud customers anticipating the transition to our next generation, high capacity drives. Seagate began shipping 16TB drives in late March as planned. It expects to begin ramping to high volume later in calendar 2019 and expect they will be firm's highest revenue SKU by this time next year.
The company expects to introduce drives with over 20TB in calendar year 2020, based on HAMR recording technology. This technology is supposed to provide a path to 40TB and higher capacities.
Exabyte demand for nearline drives may exceed firm's prior growth estimates of between 35% and 40% over the long term.
Seagate expects the exabyte TAM for nearline units to be above the long-term CAGR of 35% to 40% in FY20.
It also made strides on multi-actuator technology. During the recent Open Compute Project Summit, it set a speed record for video streaming data rates for HDD. The MACH.2 dual-actuator demonstrated twice the bandwidth compared to a single actuator drive.
Guidance for 4FQ19
Revenue of approximately $2.32 billion, plus or minus 5%, meaning global sales of around $10.3 billion for FY19 or 8% less compared to FY18.
HDD mix trends
| (units in million) | 2FQ19 | 3FQ19 |
| EB enterprise mission critical | 3.4 | 2.9 |
| EB enterprise nearline | 33.0 | 30.0 |
| EB client non-compute consumer electronics | 18.4 | 17.6 |
| EB client non-compute consumer | 14.2 | 11.6 |
| EB client compute, desktop+notebook | 18.4 | 14.6 |
| Enterprise as % of total revenue | 39% | 39% |
| Client non-compute as % of total revenue | 31% | 32% |
| Client compute as % of total revenue | 21% | 20% |
Revenue by products in $ million
| 1FQ19 | 2FQ19 | Q/Q Growth | % of total revenue in 2FQ19 |
|
| HDDs | 2,490 | 2,124 | -15% | 92% |
| Enterprise data solutions, SSD and others |
225 | 189 | -16% | 8% |
Seagate's HDDs from 2FQ15 to 3FQ19
| Fiscal period | HDD ASP | Exabytes | Average |
| shipped | GB/drive | ||
| 2Q15 | $61 | 61.3 | 1,077 |
| 3Q15 | $62 | 55.2 | 1,102 |
| 4Q15 | $60 | 52.0 | 1,148 |
| 1Q16 | $58 | 55.6 | 1,176 |
| 2Q16 | $59 | 60.6 | 1,320 |
| 3Q16 | $60 | 55.6 | 1,417 |
| 4Q16 | $67 | 61.7 | 1,674 |
| 1Q17 | $67 | 66.7 | 1,716 |
| 2Q17 | $66 | 68.2 | 1,709 |
| 3Q17 | $67 | 65.5 | 1,800 |
| 4Q17 | $64 | 62.2 | 1,800 |
| 1Q18 | $64 | 70.3 | 1,900 |
| 2Q18 | $68 | 87.5 | 2,200 |
| 3Q18 | $70.5 | 87.4 | 2,400 |
| 4Q18 |
$72 | 92.9 | 2,500 |
| 1Q19 | $70 | 98.8 | 2,500 |
| 2Q19 |
$68 | 87.4 | 2,400 |
| 3Q19 |
$72 |
76.7 |
2,400 |
Seagate vs. WD for 2FQ19
(revenue and net income in $ million, units in million)
| Seagate | WD | % in favor of WD |
|
| Revenue | 2,313 | 3,674 | 10% |
| Net income | 195 | (581) | NA |
| HDD shipped | 32.0 | 27.8 | -13% |
| Average GB/drive | 2,400 | 3,507 | 46% |
| Exabytes shipped | 76.7 | 97.5 | 27% |
| HDD ASP | $72 | $73 | 1% |
Abstracts of the earning call transcript:


 Subscribe to our free daily newsletter

