WW Spending on Cloud IT Infrastructure Up 48% Y/Y in 2Q18 Reaching $15.4 Billion – IDC
Leaders in order: Dell, HPE, Cisco, Lenovo and Inspur
This is a Press Release edited by StorageNewsletter.com on October 1, 2018 at 2:24 pmAccording to the International Data Corporation‘s Worldwide Quarterly Cloud IT Infrastructure Tracker, vendor revenue from sales of infrastructure products (server, enterprise storage, and Ethernet switch) for cloud IT, including public and private cloud, grew 48.4% year over year in the second quarter of 2018 (2Q18), reaching $15.4 billion.
The analysts also raised their forecast for total spending (vendor recognized revenue plus channel revenue) on cloud IT infrastructure in 2018 to $62.2 billion with Y/Y growth of 31.1%.
Quarterly spending on public cloud IT infrastructure has more than doubled in the past three years to $10.9 billion in 2Q18, growing 58.9% year over year. By end of the year, public cloud will account for the majority, 68.2%, of the expected annual cloud IT infrastructure spending, growing at an annual rate of 36.9%. In 2Q18, spending on private cloud infrastructure reached $4.6 billion, an annual increase of 28.2%. IDC estimates that for the full year 2018, private cloud will represent 14.8% of total IT infrastructure spending, growing 20.3% Y/Y.
The combined public and private cloud revenues accounted for 48.5% of the total worldwide IT infrastructure spending in 2Q18, up from 43.5% a year ago and will account for 46.6% of the total worldwide IT infrastructure spending for the full year. Spending in all technology segments in cloud IT environments is forecast to grow by double digits in 2018. Compute platforms will be the fastest growing at 46.6%, while spending on Ethernet switches and storage platforms will grow 18.0% and 19.2% Y/Y in 2018, respectively. Investments in all three technologies will increase across all cloud deployment models – public cloud, private cloud off-premises, and private cloud on-premises.
The traditional (non-cloud) IT infrastructure segment grew 21.1% from a year ago, a rate of growth comparable to 1Q18 and exceptional for this market segment, which is expected to decline in the coming years. At $16.4 billion in 2Q18 it still accounted for the majority, 51.5%, of total worldwide IT infrastructure spending.
For the full year, worldwide spending on traditional non-cloud IT infrastructure is expected to grow by 10.3% as the market goes through a technology refresh cycle, which will wind down by 2019.
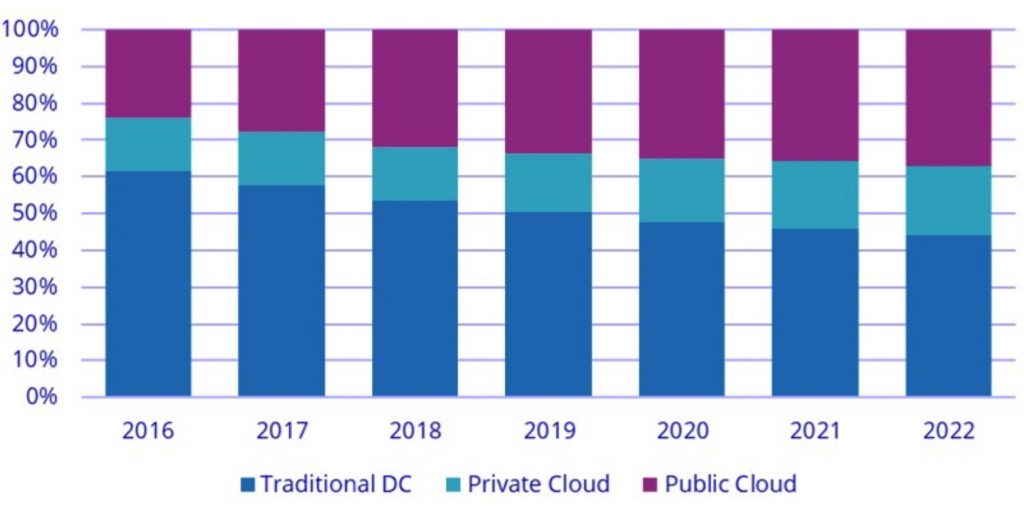
By 2022, IDC expects that traditional non-cloud IT infrastructure will only represent 44.0% of total worldwide IT infrastructure spending (down from 51.5% in 2018). This share loss and the growing share of cloud environments in overall spending on IT infrastructure is common across all regions.
“As share of cloud environments in the overall spending on IT infrastructure continues to climb and approaches 50%, it is evident that cloud, which once used to be an emerging sector of the IT infrastructure industry, is now the norm. One of the tasks for enterprises now is not only to decide on what cloud resources to use but, actually, how to manage multiple cloud resources,” said Natalya Yezhkova, research director, IT infrastructure and platforms, IDC. “End users’ ability to utilize multi-cloud resources is an important driver of further proliferation for both public and private cloud environments.“
All regions grew their cloud IT Infrastructure revenue by double digits in 2Q18. AsiaPac (excluding Japan) (APeJ) grew revenue the fastest, by 78.5% year over year. Within APeJ, China’s cloud IT revenue almost doubled year over year, growing at 96.4%, while the rest of AsiaPac (excluding Japan and China) grew 50.4%. Other regions among the fastest growing in 2Q18 included Latin America (47.4%), USA (44.9%), and Japan (35.8%).
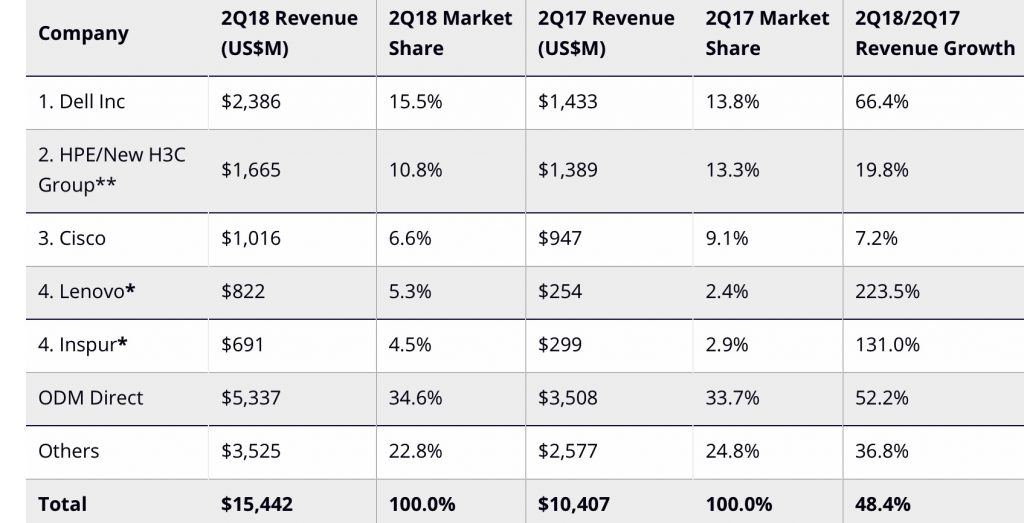
Top Companies, WW Cloud IT Infrastructure Vendor Revenue, Market Share,
and Y/Y Growth, 2Q18
(revenue in $million)

Notes:
* IDC declares a statistical tie in the worldwide cloud IT infrastructure market when there is a difference of one percent or less in the vendor revenue shares among two or more vendors.
** Due to the existing joint venture between HPE and the New H3C Group, IDC will be reporting external market share on a global level for HPE as HPE/New H3C Group starting from 2Q16 and going forward.
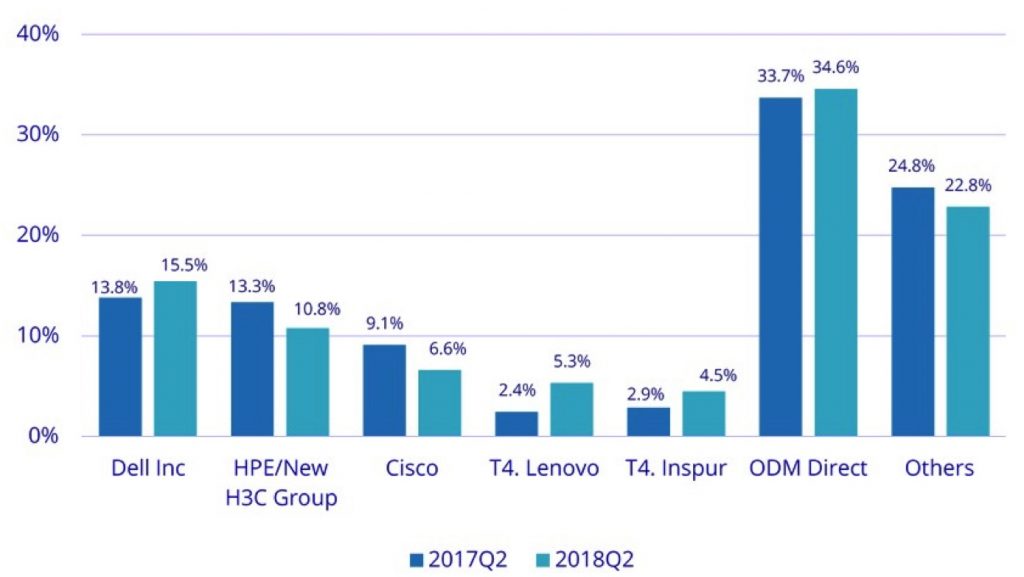
WW Cloud IT Infrastructure Top 5 Vendors Revenue, 2Q18 vs. 2Q17
(shared based on vendor revenue)

Long-term, IDC expects spending on cloud IT infrastructure to grow at a five-year CAGR of 11.2%, reaching $82.9 billion in 2022, and accounting for 56.0% of total IT infrastructure spend. Public cloud datacenters will account for 66.0% of this amount, growing at an 11.3% CAGR. Spending on private cloud infrastructure will grow at a CAGR of 12.0%.
WW Cloud IT Infrastructure Market Forecast by Deployment Type, 2016-2022
(shares based on value)

Taxonomy Notes
IDC defines cloud services more formally through a checklist of key attributes that an offering must manifest to end users of the service. Public cloud services are shared among unrelated enterprises and consumers; open to a largely unrestricted universe of potential users; and designed for a market, not a single enterprise. The public cloud market includes variety of services designed to extend or, in some cases, replace IT infrastructure deployed in corporate datacenters. It also includes content services delivered by a group of suppliers IDC calls Value Added Content Providers (VACP). Private cloud services are shared within a single enterprise or an extended enterprise with restrictions on access and level of resource dedication and defined/controlled by the enterprise (and beyond the control available in public cloud offerings); can be onsite or offsite; and can be managed by a third-party or in-house staff. In private cloud that is managed by in-house staff, ‘vendors (cloud service providers)’ are equivalent to the IT departments/shared service departments within enterprises/groups. In this utilization model, where standardized services are jointly used within the enterprise/group, business departments, offices, and employees are the ‘service users.’
IDC defines Compute Platforms as compute intensive servers. Storage Platforms includes storage intensive servers as well as external storage and storage expansion (JBOD) systems. Storage intensive servers are defined based on high storage media density. Servers with low storage density are defined as compute intensive systems. Storage Platforms does not include internal storage media from compute intensive servers. There is no overlap in revenue between Compute Platforms and Storage Platforms, in contrast with IDC’s Server Tracker and Enterprise Storage Systems Tracker, which include overlaps in portions of revenue associated with server-based storage.
Read also:
WW Spending on IT Infrastructure (Server, Enterprise Storage and Ethernet Switches) for Deployment in Cloud Environments Up 12.4% Y/Y in 2017 to $40 Billion – IDC
Fastest growing among IT deployment segments this year
2017.07.06 | Press Release
WW Cloud IT Infrastructure Spending Up 18% in 2017 – IDC
To reach $44.2 billion
2017.01.20 | Press Release


 Subscribe to our free daily newsletter

