WW Enterprise Storage Market Grew 14% in 3Q17 to $11.8 Billion – IDC
Dell leader for external systems but with revenue declining
This is a Press Release edited by StorageNewsletter.com on December 1, 2017 at 2:38 pmTotal worldwide enterprise storage systems factory revenue was up 14.0% year over year and reached $11.8 billion in 3Q17, according to the International Data Corporation‘s Worldwide Quarterly Enterprise Storage Systems Tracker.
Total capacity shipments were up 22.4% year over year to 72.5EB during the quarter.
Revenue growth increased within the group of original design manufacturers (ODMs) that sell directly to hyperscale datacenters. This portion of the market was up 54.8% year over year to just under $2.7 billion.
Sales of server-based storage increased 8.7% during the quarter and accounted for $3.5 billion in revenue.
External storage systems remained the largest market segment, with the $5.6 billion in sales represented an increase of 4.1% year over year.
“The enterprise storage market finished the third quarter of 2017 on a positive note, posting strong year-over-year growth and the first double-digit growth in several years,” said Liz Conner, research manager, storage systems. “All-flash, software-defined, and converged/hyperconverged systems continue to be the driving force for traditional storage vendors. Meanwhile, hyperscalers once again saw event-driven storage requirements lead to strong growth in this segment during the third quarter.”
3Q17 Total Enterprise Storage Systems Market Results, by Company
HPE/New H3C Group held the number 1 position within the total worldwide enterprise storage systems market, accounting for 20.2% of spending. Dell Inc held the next position with a 18.8% share of revenue during the quarter. NetApp finished third with 6.0% market share. IBM and Hitachi finished in a tie* for the fourth position, capturing 4.3% and 4.0% of global spending, respectively. As a single group, storage systems sales by ODMs selling directly to hyperscale datacenter customers accounted for 22.7% of global spending during the quarter.
Top 5 vendor groups, WW total enterprise storage systems market, 3Q17

3Q17 External Enterprise Storage Systems Results, by Company
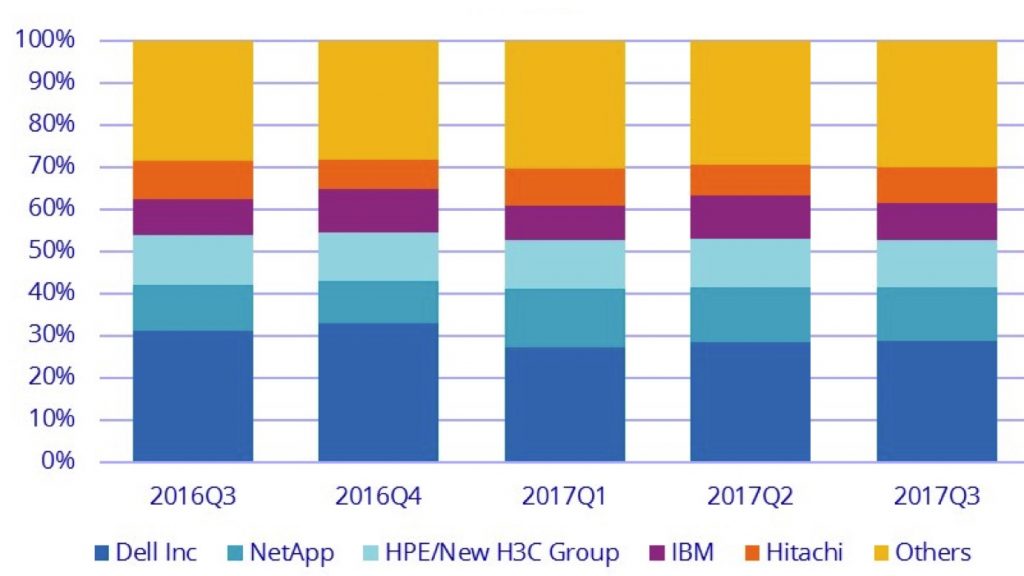
Dell Inc. was the largest external enterprise storage systems supplier during the quarter, accounting for 28.8% of worldwide revenues. NetApp finished in the number 2 position and HPE in the number 3 position with 12.5% and 11.4% of market share, respectively. IBM and Hitachi rounded out the top 5 in a tie* with revenue shares of 8.7% and 8.3%, respectively.
Top 5 vendor groups, WWW external enterprise storage systems market, 3Q17

Notes:
a – Dell Inc. represents the combined revenues for Dell and EMC.
b – Due to the existing joint venture between HPE and the New H3C Group, IDC will be reporting external market share on a global level for HPE as HPE/New H3C Group starting from 2Q16 and going forward.
c – HPE/New H3C Group includes the acquisition of Nimble, completed in April 2017
* – IDC declares a statistical tie in the worldwide enterprise storage systems market when there is less than one% difference in the revenue share of two or more vendors.
Top 5 vendor groups, WWW external enterprise storage systems market, 3Q17 revenue market share

Flash-Based Storage Systems Highlights
The total all-flash array (AFA) market generated just shy of $1.6 billion in revenue during the quarter, up 38.1% year over year. The hybrid flash array (HFA) segment of the market continues to be a significant part of the overall market with $2.3 billion in revenue and 19.1% of the total market share.
Taxonomy Notes
IDC defines an enterprise storage system as a set of storage elements, including controllers, cables, and (in some instances) HBAs, associated with three or more disks. A system may be located outside of or within a server cabinet and the average cost of the disk storage systems does not include infrastructure storage hardware (i.e. switches) and non-bundled storage software.
The information in this quantitative study is based on a branded view of the enterprise storage systems sale. Revenue associated with the products to the end user is attributed to the seller (brand) of the product, not the manufacturer. OEM sales are not included in this study.


 Subscribe to our free daily newsletter


