Total WW Data to Reach 163ZB by 2025
Ten times more than today
This is a Press Release edited by StorageNewsletter.com on April 5, 2017 at 2:38 pmThis white paper was written David Reinsel, John Gantz and John Rydning, analysts at IDC Corp. on March 2017, sponsored by Seagate Technology LLC.
Data Age 2025: The Evolution of Data to Life-Critical
Don’t Focus on Big Data; Focus on the Data That’s Big
Executive Summary
We are fast approaching a new era of the Data Age. From autonomous cars to humanoid robots and from intelligent personal assistants to smart home devices, the world around us is undergoing a fundamental change, transforming the way we live, work, and play.
Imagine being awoken and tended to by a virtual personal assistant that advises you on what clothing from your wardrobe is best suited to the weather report and your schedule for the day or being transported by your self-driving car. Or perhaps you won’t need to commute to an office at all as technology will allow you to conjure workspaces out of thin air using interactive surfaces, and holographic teleconferencing becomes the norm for communicating virtually with colleagues. Weekends may involve browsing new furniture through an augmented reality app and seeing how a sofa looks in your living room before placing an order. As you relax on the new sofa, Saturday night’s takeout will be a pizza made by a robot and delivered in record time by a drone.
Data has become critical to all aspects of human life over the course of the past 30 years; it’s changed how we’re educated and entertained, and it informs the way we experience people, business, and the wider world around us. It is the lifeblood of our rapidly growing digital existence. This digital existence, as de ned by the sum of all data created, captured, and replicated on our planet in any given year is growing rapidly, and we call it the ‘global datasphere’. In just the past 10 years society has witnessed the transition of analog to digital. What the next decade will bring using the power of data is virtually limitless.
While we as consumers will enjoy the benefits of a digital existence, enterprises around the globe will be embracing new and unique business opportunities, powered by this wealth of data and the insight it provides. Extracting and delivering simplicity and convenience from the complexity of many billions of bytes – be it through robotics, 3D printing, or some other yet-to-come technological innovation – will be the order of the day. The opportunities already seem limitless, as does the sheer volume of data these connected devices and services will create.
From power grids and water systems to hospitals, public transportation, and road networks, the growth of real-time data is remarkable for its volume and criticality. Where once data primarily drove successful business operations, today it is a vital element in the smooth operation of all aspects of daily life for consumers, governments, and businesses alike.
In this white paper, sponsored by Seagate, IDC looks at the trends driving growth in the global datasphere from now to 2025. We look at their implications for people and businesses as they manage, store, and secure their most critical data.
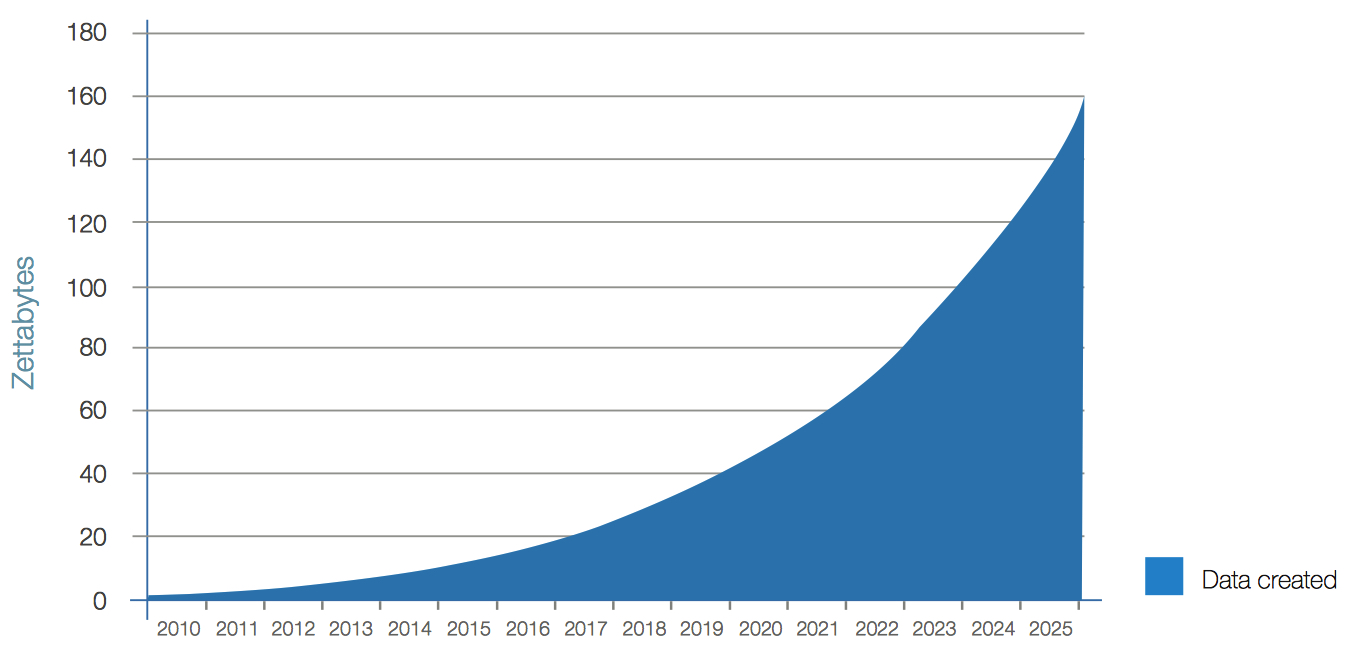
IDC forecasts that by 2025 the global datasphere will grow to 163ZB (that is a trillion gigabytes). That’s ten times the 16.1ZB of data generated in 2016. All this data will unlock unique user experiences and a new world of business opportunities.
Data Age 2025 describes five key trends that will intensify the role of data in changing our world:
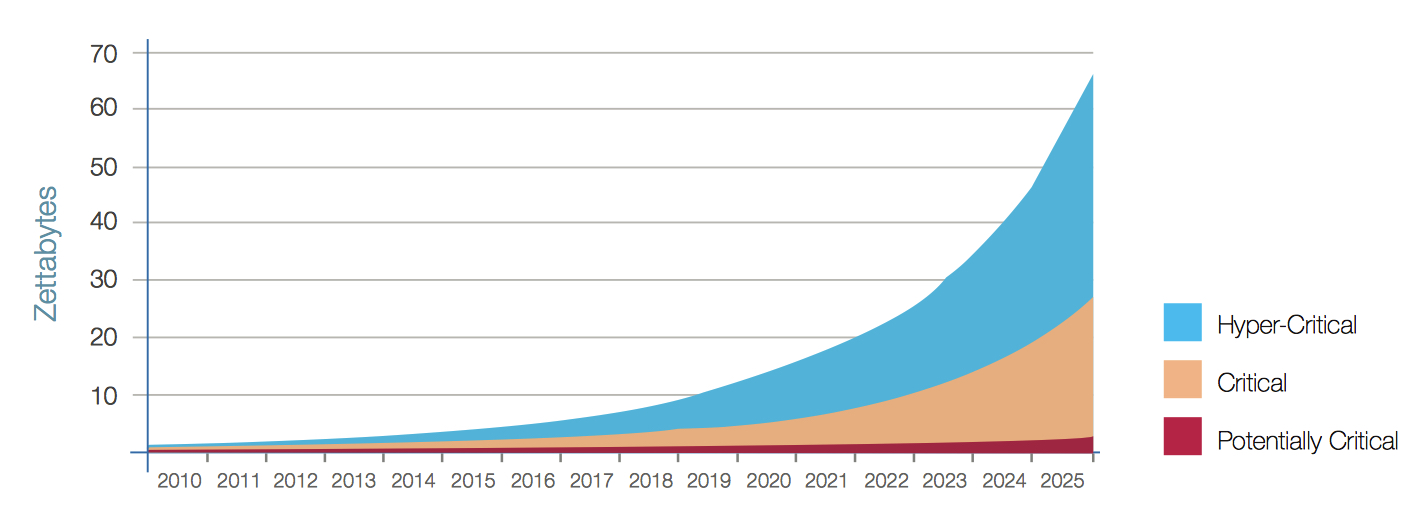
• The evolution of data from business background to life-critical. Once siloed, remote, inaccessible, and mostly underutilized, data has become essential to our society and our individual lives. In fact, IDC estimates that by 2025, nearly 20% of the data in the global datasphere will be critical to our daily lives and nearly 10% of that will be hypercritical.
• Embedded systems and the IoT. As standalone analog devices give way to connected digital devices, the latter will generate vast amounts of data that will, in turn, allow us the chance to re ne and improve our systems and processes in previously unimagined ways. big data and metadata (data about data) will eventually touch nearly every aspect of our lives – with profound consequences. By 2025, an average connected person anywhere in the world will interact with connected devices nearly 4,800 times per day – basically one interaction every 18s.
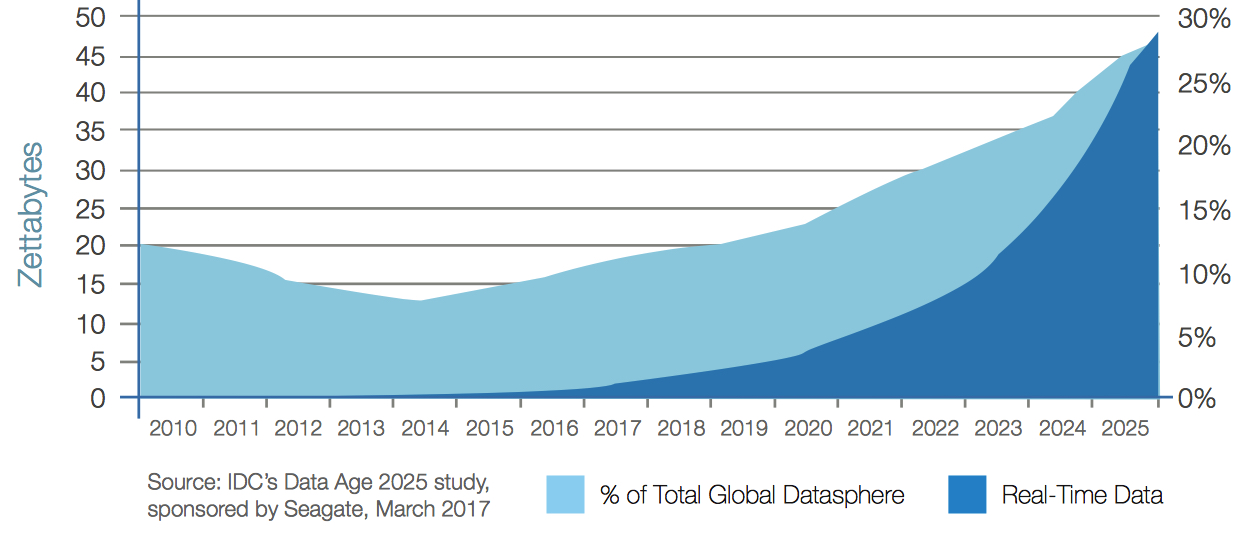
• Mobile and real-time data. Increasingly, data will need to be instantly available whenever and wherever anyone needs it. Industries around the world are undergoing ‘digital transformation’ motivated by these requirements. By 2025, more than a quarter of data created in the global datasphere will be real time in nature, and real-time IoT data will make up more than 95% of this.
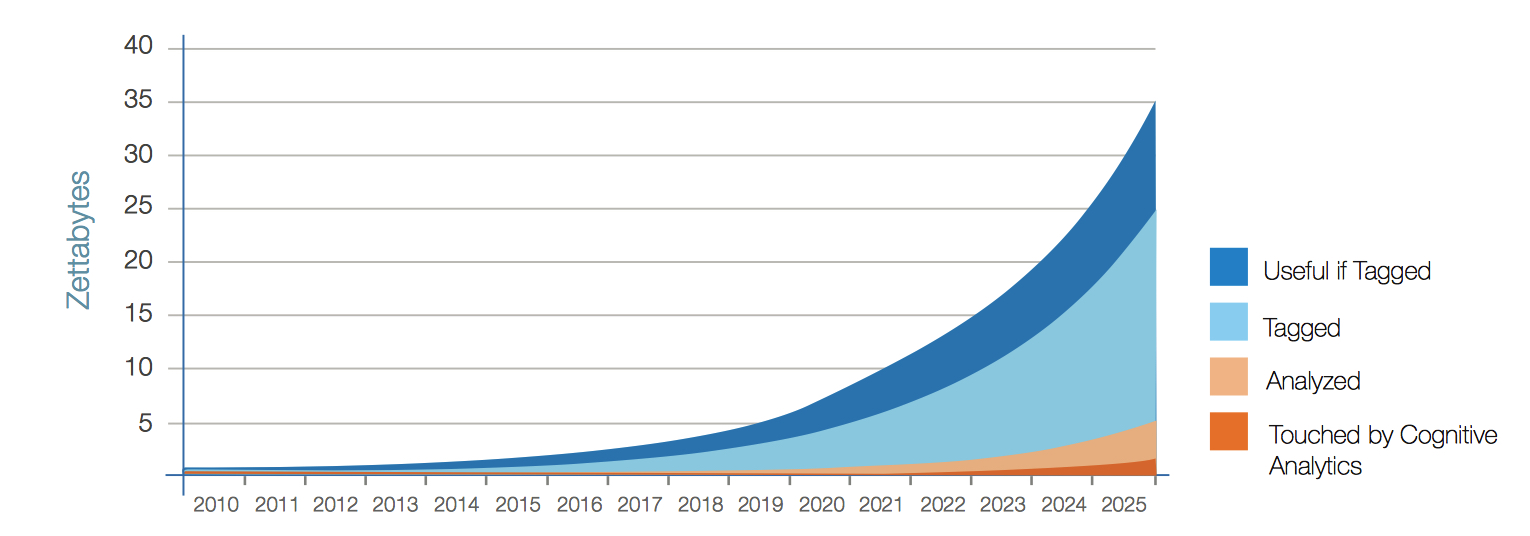
• Cognitive/artificial intelligence (AI) systems that change the landscape. The flood of data enables a new set of technologies such as machine learning, natural language processing, and AI – collectively known as cognitive systems – to turn data analysis from an uncommon and retrospective practice into a proactive driver of strategic decision and action. Cognitive systems can greatly step up the frequency, flexibility, and immediacy of data analysis across a range of industries, circumstances, and applications. IDC estimates that the amount of the global datasphere subject to data analysis will grow by a factor of 50 to 5.2ZB in 2025; the amount of analyzed data that is ‘touched’ by cognitive systems will grow by a factor of 100 to 1.4ZB in 2025.
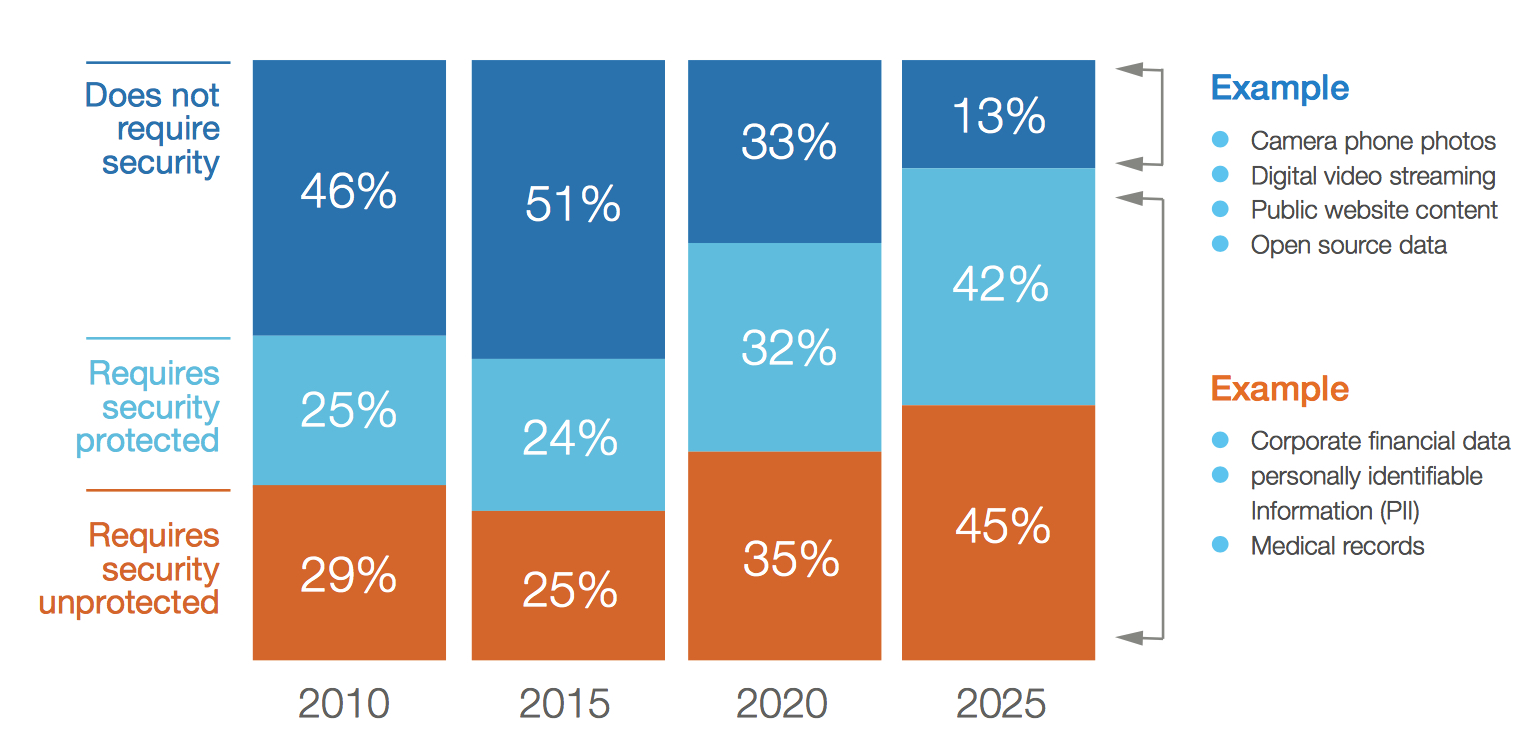
• Security as a critical foundation. All this data from new sources open up new vulnerabilities to private and sensitive information. There is a significant gap between the amount of data being produced today that requires security and the amount of data that is actually being secured, and this gap will widen – a reality of our data-driven world. By 2025, almost 90% of all data created in the global datasphere will require some level of security, but less than half will be secured.
As data grows in amount, variety, and importance, business leaders must focus their attention on the data that matters the most. Not all data is equally important to businesses or consumers. The enterprises that thrive during this data transformation will be those that can identify and take advantage of the critical subset of data that will drive meaningful positive impact for user experience, solving complex problems, and creating new economies of scale. Business leaders should focus on identifying and servicing that unique, critical slice of data to realize the vast potential it holds.
From Business Background to Life-Critical
Contemporary society generates, uses, and retains amounts of data that would be considered huge – if not unimaginable – by any earlier standard. Yet IDC expects the size of the global datasphere to continue to grow in the coming few years and eclipse what exists today. IDC estimates that in 2025, the world will create and replicate 163ZB of data, representing a tenfold increase from the amount of data created in 2016. This hypergrowth is the outcome of an evolution of computing that goes back decades.
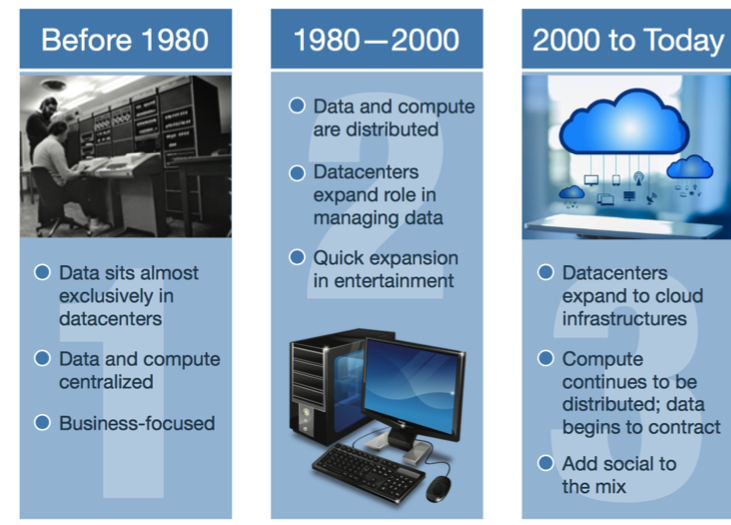
As shown in Figure 1, IDC categorizes the creation and use of compute data broadly
into three main eras:
• 1st Platform (before 1980). Data resided almost exclusively in purpose-built datacenters before 1980. Even when people accessed data from remote terminals, the terminals were dumb machines with little, if any, computing power. The data and processing ability remained centralized in mainframes. The purpose of data generation and use was almost entirely business focused.
• 2nd Platform (1980 to 2000). The rise of the personal computer and the might of Moore’s law enabled a more democratic distribution of data and computing power. Data centers evolved from mere data containers to become centralized hubs that managed and distributed data across a slow but developing network to end devices. These devices gained the ability to store and manage data for purely personal use by consumers, and a digital entertainment industry of music, movies, and games emerged.
• 3rd Platform (2000 to today). The proliferation of wireless broadband and fast networks encouraged data’s movement into the cloud, decoupling data from specific physical devices and ushering in the era of accessing data from any screen. Datacenters expanded into cloud infrastructure through popular services from Amazon, Google, Microsoft, and others. The distribution of computing power continued with the rise of new device types such as phones, wearables, and gaming consoles. Endpoint devices such as these and traditional PCs still require data to operate, but the necessary data is easily accessible through the cloud, requiring less and less local storage. These trends drive and, in turn, are driven by the increased importance of computing in B2B, B2C, and social interaction.
Figure 1: Evolution of Computing
This is the state of our data-driven world today. Tremendous advances in the density of computing power and storage and availability enable entirely new applications and locations for digital technology and services. The resulting demand in turn drives further advances in our ability to collect, manage, process, and deliver data – in context, in step with business work ows, and in the stream of life. The consequence of this recursive cycle is explosive growth in the global datasphere (see Figure 2).
Figure 2: Annual Size of the Global Datasphere
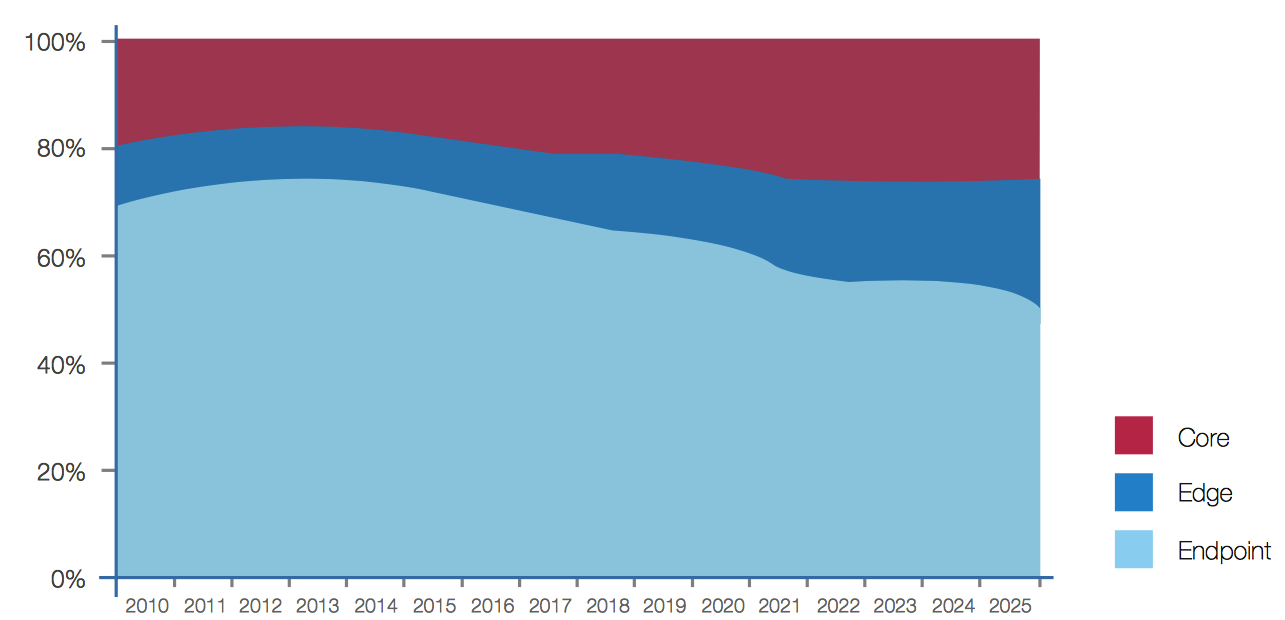
Data’s evolutionary role in the world becomes readily apparent in the amount of data created and utilized by different computing platform types over time. Changing usage becomes visible by comparing computing platforms in three location categories:
• Core refers to designated computing datacenters in the enterprise and cloud. This includes all varieties of cloud computing, including public, private, and hybrid cloud. It also includes operational control centers, such as those running the electric grid or telephone networks.
• Edge refers to enterprise-hardened computers/appliances that are not in core datacenters. This includes server rooms, servers in the eld, and smaller datacenters located regionally for faster response times.
• Endpoint refers to all devices on the edge of the network, including PCs, phones, cameras, connected cars, wearables, and sensors.
In percentage of total data creation, endpoints have given considerable ground since 2012 and are expected to continue doing so (see Figure 3). Over the past decade, endpoint growth came from PCs, smart phones, and other consumer devices. Although endpoint growth continues, the largest component of this future growth will be in embedded devices such as security cameras, smart meters, chip cards, and vending machines, which produce data in small signals. In the meantime, big data analytics, cloud applications, and real-time data requirements are pushing faster growth in core and edge platforms.
While mobile communication networks continue to improve in speed and reliability, time-sensitive applications that impact the QoS, or even the sustenance of life, require data fabrics to extend out from the datacenter core to a dynamic enterprise edge. Software-defined storage technology enables rapid creation and migration of edge storage environments wherein the intersection of live data and big data analytics occurs, meeting the need of local and mobile analytic workloads. Delivering data in this way will enable seamless and efficient traffic flow management among connected vehicles (e.g., prioritized traffic protocols for emergency response vehicles) or real-time fraud detection or facial recognition for improved security at sporting events or transportation hubs. The growing amount of data creation across an increasing number of connected devices in a mobile, real-time world is a fundamental driver of edge storage.
Figure 3: Where Data is Created
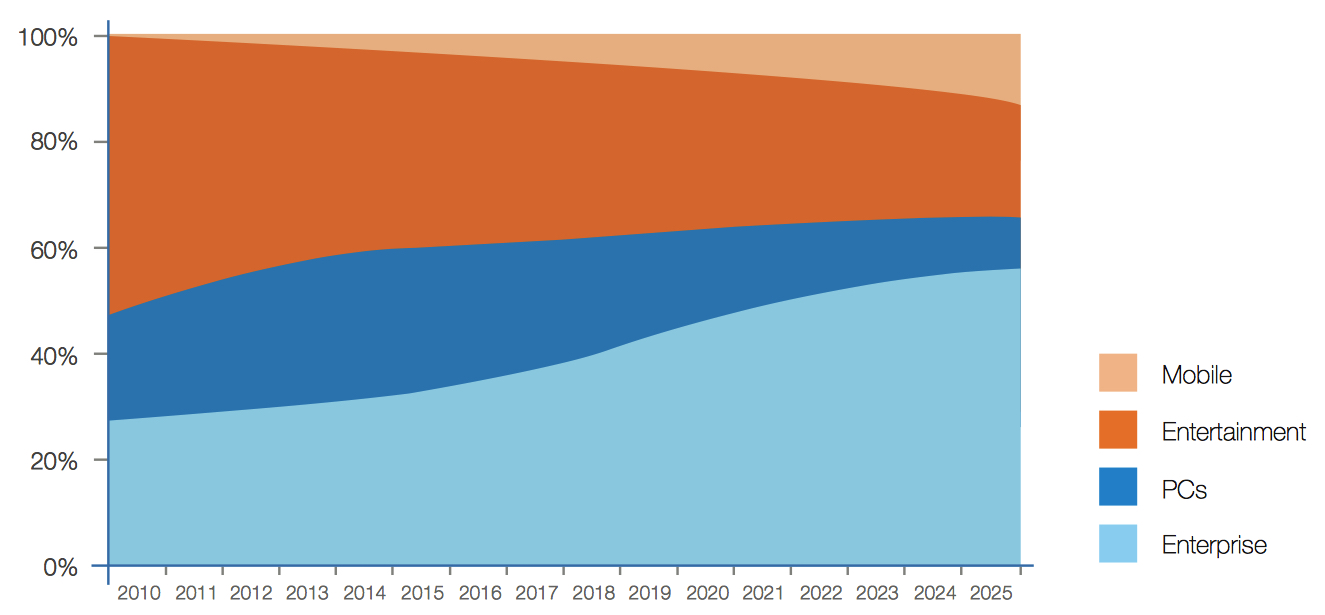
We see another rapidly changing landscape when evaluating the platforms that generate and ultimately store data (see Figure 4). One of the fundamental realities occurring is the resurgence of the enterprise as a location for data usage. From 1980 to the early 2000s, PCs and entertainment media dominated data creation and consumption. However, with improved network and IP connectivity over time, there is less need for data to be stored locally on PCs and other mobile devices. In 2010, nearly 50% of data that was stored was for entertainment purposes, resulting from the distribution of a great many DVDs and Blu-ray discs. As consumer video consumption shifts subsequently to streaming services, the share of storage within enterprise infrastructure rises and entertainment-related device stored data drops.
Other shifts reflect the major trends brought about by the 3rd Platform of computing, including mobile, social, big data analytics, high definition video, and cloud computing. The rise of cloud storage increases enterprise usage. Mobile devices, although small, rise rapidly through the projected time period as businesses endeavor to deliver data and services to their customers in real time via these devices.
Figure 4: Where Data is Stored
The ultimate outcome of the shift to cloud-based, fast-access, and truly mobile data usage is that data has increasingly become a critical in influencer for not only our businesses but also our lives in all aspects.
Consider the current state of commercial air travel. The airline industry has thoughtfully deployed its every resource – aircraft, gates, runways, flight crew members, and air traffic controllers – to extract optimal capacity from the air travel infrastructure. This highly interdependent system can be vulnerable to domino effects as a hiccup in any part of the system potentially cascades outward, disrupting travel hours or even days later and thousands of miles away. The airline industry has responded by tapping into the data surrounding itineraries, delays, passenger numbers, maintenance records, and weather so that it can anticipate potential problems and respond immediately and effectively. Some use of this data takes a more traditional approach (such as looking at a route’s on-time arrival record when planning any given aircraft’s allocation as a resource), but airlines use this data in real time more and more to adjust to contingencies as they arise.
Increasingly, data usage is being analyzed by its level of criticality as indicated by factors such as the need for real-time processing and low latency, the ad hoc nature of usage, and the severity of consequences should the data become unavailable (e.g., a medical application is considered to be more consequential than a streaming TV program). IDC estimates that by 2025, nearly 20% of the data in the datasphere will be critical to our lives and 10% of that will be hypercritical (see Figure 5).
It’s one thing to lose a spreadsheet because of a PC crash; it’s another to cause physical harm because of errant data in a self-driving car. These events are not about business reputations but instead about business existence. The emergence of hypercritical data must compel businesses to develop and deploy data capture, analytics, and infrastructure that delivers extremely high reliability, bandwidth, and availability; more secure systems; new business practices; and even new legal infrastructures to mitigate exposure to shifting and potentially debilitating liabilities.
Figure 5: Data Criticality Over Time
Embedded Systems and the IoTs
In earlier periods, data growth stemmed largely from the rise of the personal computer and the consumption of digital entertainment. The world today contains more consumer devices (PCs, phones, game consoles, and music players) than human beings, and all these devices need data to operate. However, by now, the conversion from analog lm and TV to digital is largely complete. The switch from discrete consumption units such as DVDs to streaming services will continue to drive some growth, as will the industry’s evolution to higher-quality content (e.g., 4K or 8K video).
The embedding of computing power in a large number of endpoint devices has become a key contributor to data growth in our present era. Today, the number of embedded system devices feeding into datacenters is less than one per person globally, and over the next 10 years, that number will increase to more than four per person. While data from embedded systems tends to be very ef cient compared with data from entertainment and other consumer usage, the number of files generated will be very large, measuring in the quintillions per year. To put that number in perspective, it would take Niagara Falls 210,000 years to move one quintillion gallons of water.
All these embedded devices creating data fuel the growth and value of big data applications and metadata. One example of a metadata application is Netflix’s use of viewer data. By monitoring preferences in viewing choices (such as preferred actors or genres), Netflix is able to tailor its suggested movie lists to match subscribers’ demonstrated desires. The Netflix original series House of Cards is a good example. The observed popularity among Netflix customers of actor Kevin Spacey, director David Fincher, political thrillers, and the British series of the same name contributed to greenlighting the creation of the Netflix version, and its subsequent success testi es to the strength of this approach.
The data from most embedded devices is less readily visible than your Netflix queue, but these devices still produce data about their operation, which is immensely helpful to the larger systems of which they are a part. Systems like shopping malls, traffic grids, and cellular networks produce huge numbers of raw data points, which in turn generate metadata about themselves. This metadata is the data that not only enables ongoing operation and improvement of the system but also helps de ne context in other analyses. Disney theme parks’ MagicBand has utility for the park visitor as it acts as a combination of park pass, room key, and charge account – all in a convenient form factor. It’s also a source for valuable data that Disney can use to help optimize – and monetize – its parks. Not only does the MagicBand yield data at the level of the individual, for example, establishing that this person is allowed to enter a park or open a room door, but it also offers the chance for very rich analysis of metadata around how park visitors move about and use the park and adjoining facilities and how this behavior changes in response to stimuli Disney may provide.
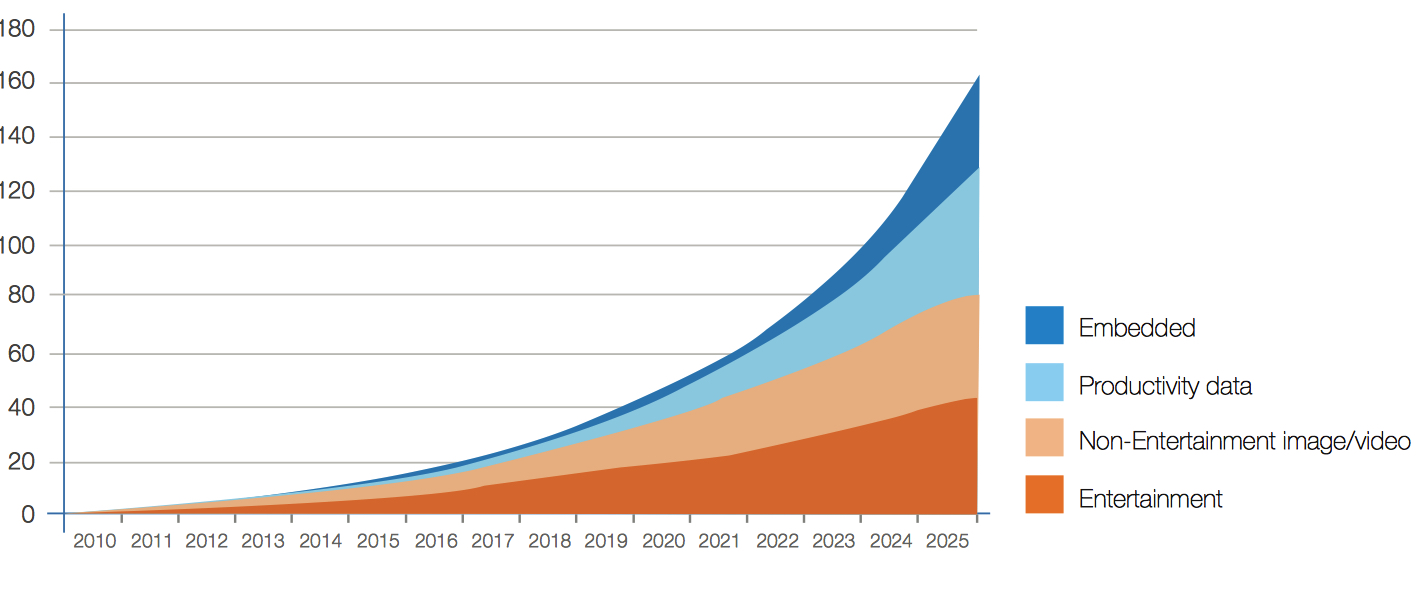
As there are many types of devices generating data, IDC segments the global datasphere into four major classifications (see Figure 6).
The data type categories are:
• Entertainment. Image and video content created or consumed for entertainment purposes.
• Non-entertainment image/video. Image and video content for non- entertainment purposes, such as video surveillance footage or advertising.
• Productivity data. Traditional productivity-driven data such as files on PCs and servers, log files, and metadata.
• Embedded. Data created by embedded devices, machine-to-machine, and IoT.
Figure 6: Data Creation by Type
The mix of data creation by type has been changing over time (see Figure 7). A sharp decrease in entertainment data in total share and the rise of productivity and especially embedded data in our lives to come are readily seen by analyzing the share of data creation by type.
Figure 7: Data Creation Share by Type
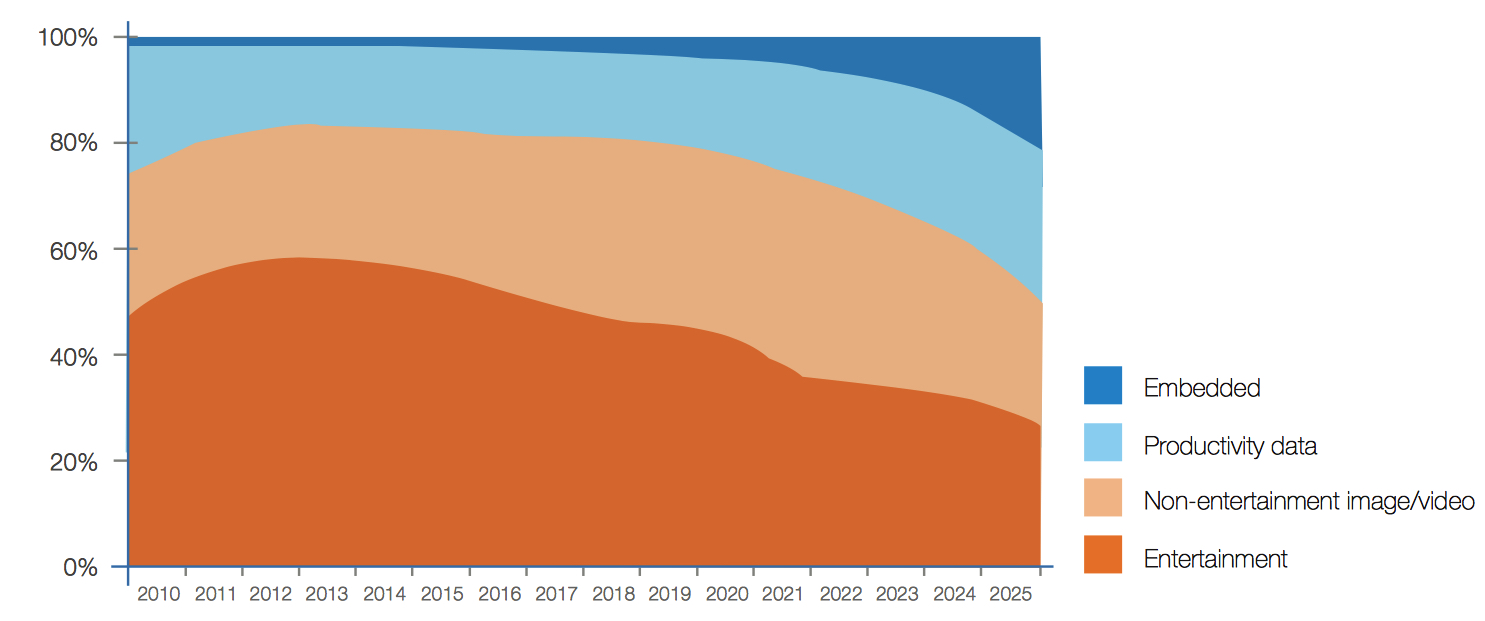
By 2025, embedded data will constitute nearly 20% of all data created – three-quarters the size of productivity data and closing fast. Productivity data comes from a set of traditional computing platforms such as PCs, servers, phones, and tablets.
Embedded data, on the other hand, comes from a variety of device types, including:
- Security cameras
- Smart meters
- Chip cards
- RFID readers
- Fueling stations
- Building automation
- Smart infrastructure
- Machine tools
- Automobiles, boats, planes, busses, and trains
- Vending machines
- Digital signage
- Casinos
- Wearables
- Medical implants
- Toys
All these embedded devices will increase the average person’s level of interaction with data, changing the user experience. This tendency is visible already in a platform like Facebook, which tunes content and ad streams based on each individual’s propensity to interact with specific types of content. The average rate per capita of data-driven interactions per day is expected to increase 20-fold in the next 10 years as our homes, workplaces, appliances, vehicles, wearables, and implants become data enabled (see Figure 8).
Figure 8: Interactions per Connected Person per Day
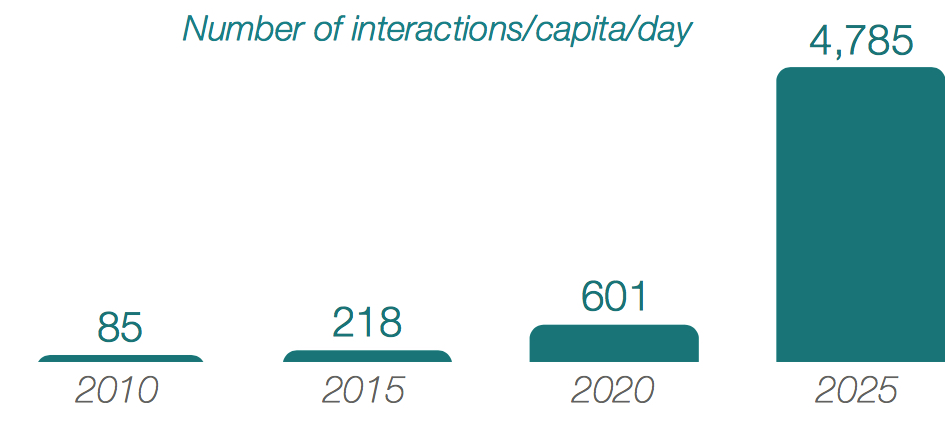
Much of this interaction will fade into the background as intelligent assistants like the Amazon Echo and intelligence built into cars become part of the environment with which consumers habitually interact – increasing to one interaction every 18s, on average. The ultimate impact of this explosion in data interactions will be profound and lead to irreversible changes in society and in the fabric and quality of the average person’s daily stream of life.
Despite having a profound impact on daily life, the vast majority of the global datasphere is used and discarded rather than stored. This is primarily a reflection of the fact that most data is fundamentally disposable once it has been used or transferred. To go back to the earlier example of streaming video, there is no reason to store the content of each individual streaming session for the same program. Here is where metadata comes into play. The streaming service needs to retain merely the knowledge of that specific video-viewing event. This knowledge can be reasonably sophisticated, including when and for how long the show was paused or fast-forwarded and whether or not the viewer watched the full show and on which device (or devices). Nonetheless, this metadata – the set of data potentially useful to the streaming service – is many orders of magnitude smaller than the original streaming event. This approach represents an efficiency lesson taken from the previous decade of data growth. From the huge amount of data created we are prioritizing which data has sufficient value to be stored.
Similarly, IoT devices are likely to generate a great deal of data without the need for long-term retention after analysis. Take the example of video surveillance cameras. Cameras create extremely rich data in the form of video. Typically, there will be a baseline of video capturing normal behavior that carries a very small retention requirement along with a subset of incidents that need to be available in the future. Among the data generated by a traffic camera, local transportation authorities value the video of traffic violations or abnormal traffic and can discard the regular, lawful flow of traffic after creating appropriate metadata. For a casino video surveillance system, casino operators value and retain only episodes of suspicious behavior, while the rest is safe to discard after creation of metadata and an appropriate period of time.
In both of these examples, we see the application of smart criteria to which data to retain, in what form, and for how long. That way we can hang onto critical information without the need to store all the data produced. This sort of discerning data retention policy is a hallmark of current best practices in data retention.
The result is that the quantity of data generation can and will continue to outpace any reasonable expectation of our ability to store all of the data. For example, it would take roughly 16 billion of today’s largest 12TB enterprise HDDs to store the 163ZB data expected to be created in 2025. To put that into perspective, over the past 20 years, the disk drive industry shipped 8 billion HDDs and nearly 4ZB of capacity.
Of course, there will always exist ample opportunities to store more data, whether it is from unforeseen big data applications that result in more data tagging of the global datasphere or because of new data retention regulations that come into existence. Regardless, based on current expectations, storage demands are poised to continue their aggressive growth with no end in sight. IDC expects that to keep up with Data Age 2025 projections, storage capacity shipments across all media types (HDD, flash, tape, optical, and DRAM) over the next 4 years (2017-2020) will have
to surpass the 5.5ZB shipped across all media types over the past 10 years. In fact, the Data Age 2025 research projects that over 19ZB of storage capacity must ship across all media types from 2017 to 2025 to keep up with storage demands. Around 58% of the capacity will need to come from the HDD industry and 30% from ash technology over that same time frame.
Mobile and Real-Time Data
These increases in connectivity place a premium on mobile access and real-time responses. The number of people connected worldwide grew fivefold between 2005 and 2015. Over the same time period, mobile phone usage outpaced PC- based Internet usage, particularly in geographies with little or no physical Internet infrastructure. By 2025, connected users will number 75% of the world’s population, including previously unconnected groups like young children, the elderly, and people in emerging markets.
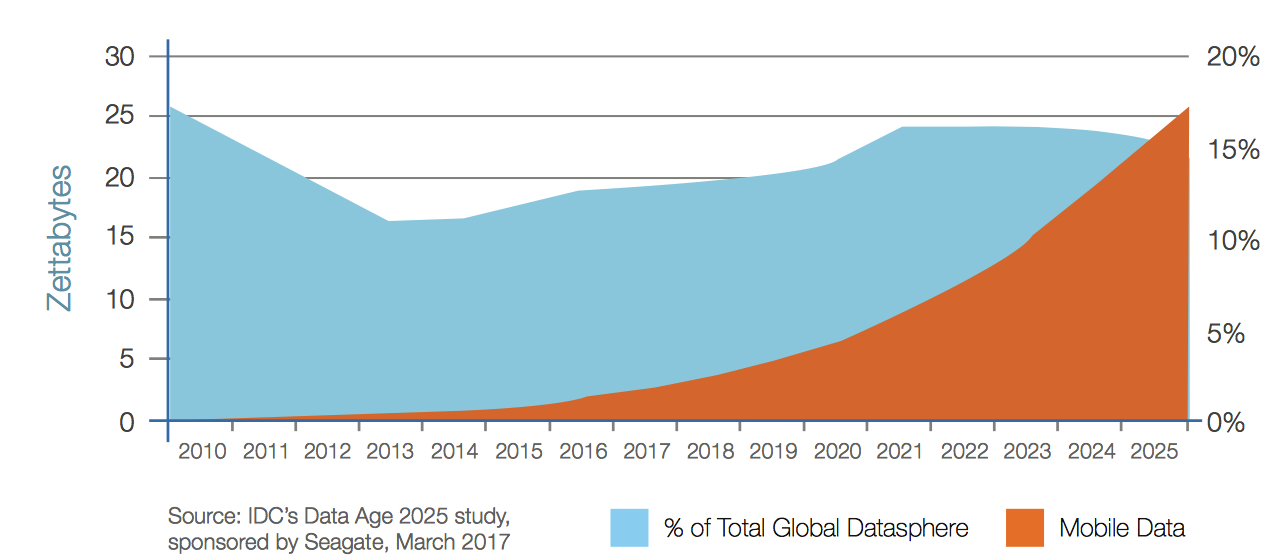
Mobile data (Figure 8) and real-time data (Figure 9) both show strong growth in the years to come. While mobile holds its own as a percentage of data created, real-time data will grow at 1.5 times the rate of overall data creation. Real-time data usage may involve mobile devices, but doesn’t have to. For example, automated machines on a manufacturing floor, though fixed, depend on real-time data for process control and improvement. In fact, the overwhelming majority of real-time data use will be driven by IoT devices (Figure 10).
Figure 11:IoT Drives Real-Time Data
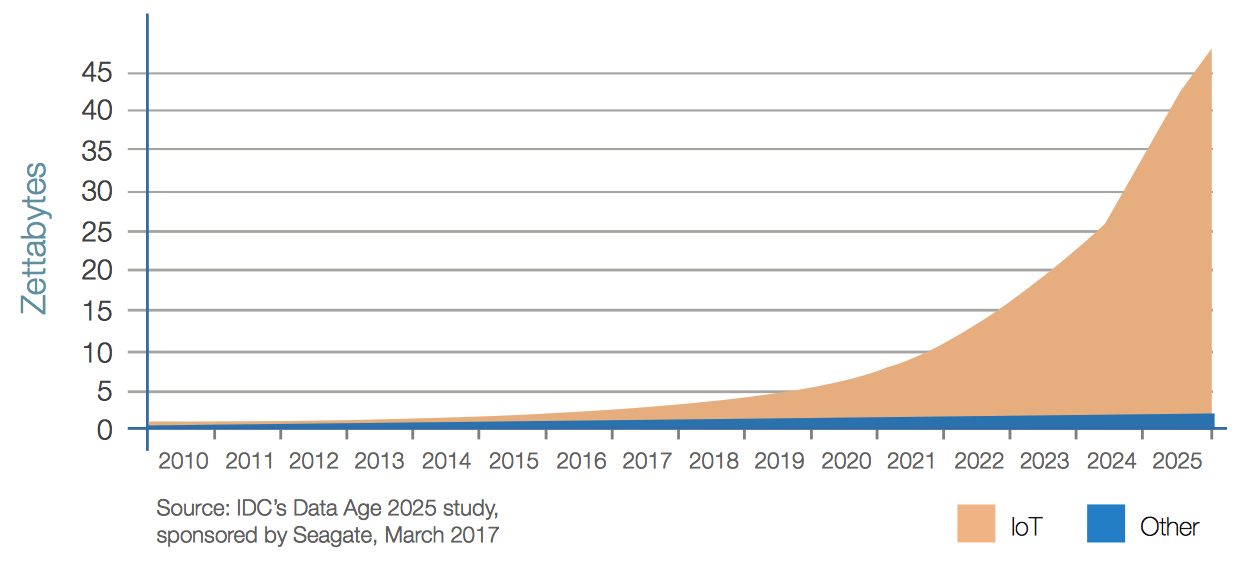
The growth of real-time data will cause a shift in the type of digital storage needed in the future (see Figure 12). The increasing need for data to be available in real time will heighten the focus on low-latency responsiveness from enterprise edge storage, as well as from the endpoints themselves.
Figure 12: Byte Shipment Share by Storage Media Type
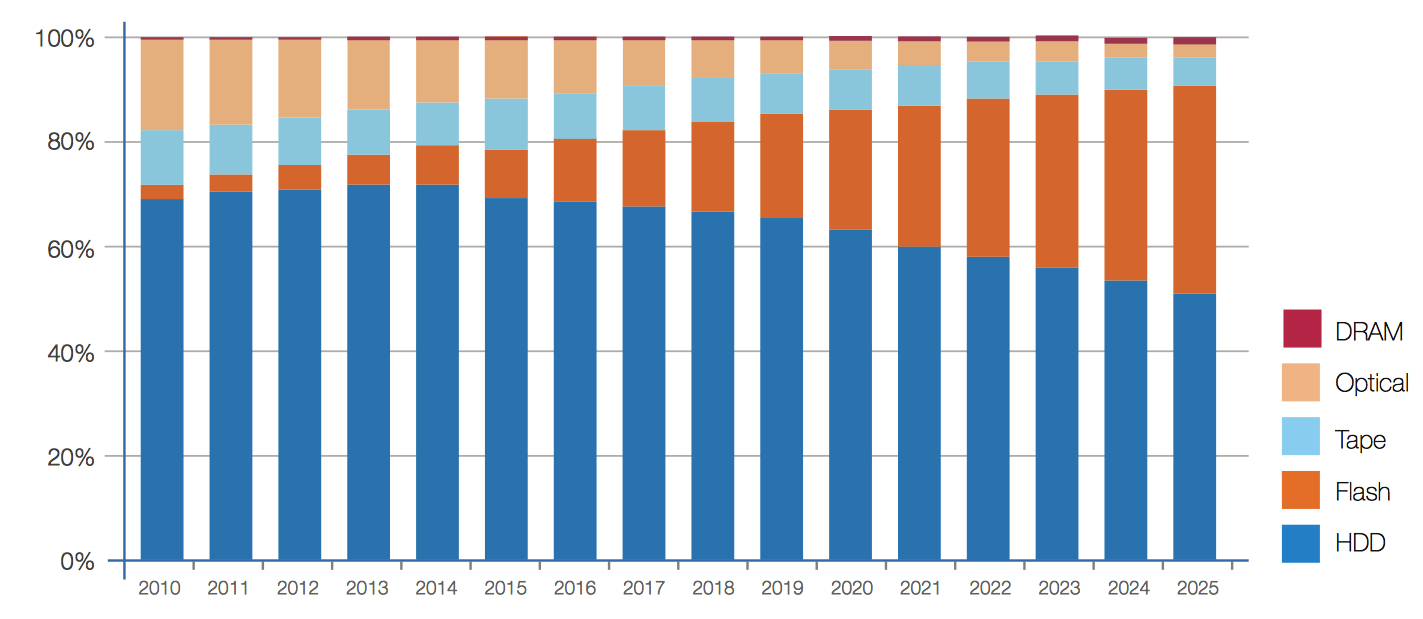
Most of the zettabyte storage growth in NAND flash comes out of a shift away from optical media. Optical media has become less important as consumers leverage CDs and DVDs far less than in years prior, instead consuming music and movies by way of streaming networks.
Concurrent with the growth of real-time data and the number of connected users is a steady increase in the amount of data stored, or ‘anchored,’ in enterprise data and control centers to power the global datasphere, many of which will be cloud-based.
In fact, IDC estimates that the percentage of data in the datasphere that is processed, stored, or delivered by public cloud datacenters will nearly double to 26% from 2016 to 2025. Such clouds will process, store, or deliver not just IT services but also entertainment, grid telemetry, and telecommunications.
Enterprise datacenters use a variety of storage media types including HDDs, and NAND flash-based storage (including emerging storage technologies similar to flash), with each playing an important role to support a broad range of storage workloads economically (see Figure 13).
Figure 13: Enterprise Byte Shipments: HDD and SSD
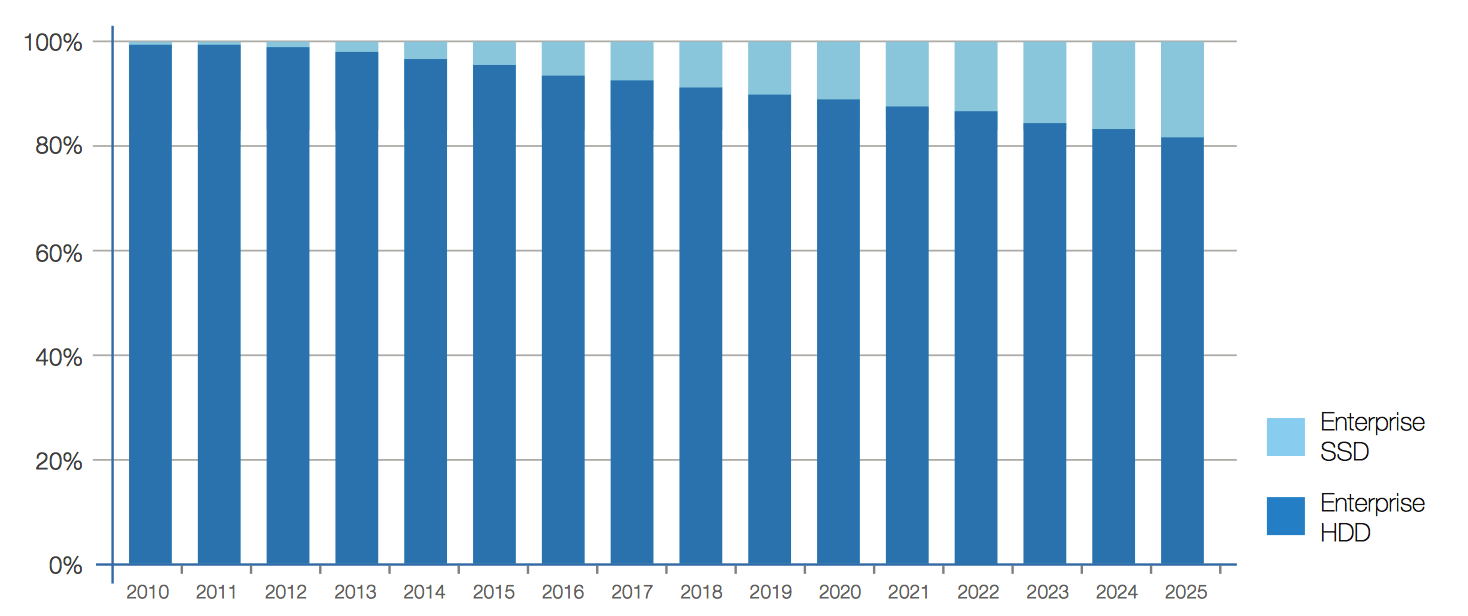
To a lesser extent, tape and optical storage will also continue to be legacy storage media types used in enterprise datacenters, yet for relatively archived data – or data that is very infrequently accessed.
Artificial Intelligence Systems Change the Landscape
The exploding quantity and availability of data increase the leverage cognitive/AI systems can offer to those who deploy them.
IDC estimates that by 2025, two-thirds of global financial firms will integrate cognitive data from third parties to improve the customer experience through targeted product and service offerings and fraud protection. Applications for these cognitive systems touch a large surface of our business and personal lives.
For example:
• Driverless cars, seen already on some city streets, rely on real-time telemetry and machine learning to ‘learn’ how to drive. Advances in these underlying cognitive systems will shorten the time needed to ‘teach’ driverless cars how to drive.
• Insurance companies like AIG and Japan’s Fukoku Mutual have been using AI-based ‘agents’ and ‘virtual engineers’ to support live claims agents and increase productivity.
• IBM’s Watson cognitive platform is using tools like natural language processing and machine learning to help oncologists and US-based Memorial Sloan Kettering develop targeted and individualized cancer treatments.
• A more prosaic use of facial recognition that is currently used on Disney cruises offers ‘enchanted art.’ These are pictures that play animated scenes when a passenger walks by. The system uses facial recognition to ensure that on subsequent visits, the passenger doesn’t see the same scenario.
• Most credit card companies like MasterCard routinely use AI to help with fraud detection. This enables them to detect a fraudulent transaction in as little as 40-60 milliseconds.
Data tagging, especially automated tagging, is an important aspect of using cognitive systems. Tagging, after all, applies identifiers to information to make it easy to sort, analyze, put in context, and create value. However, data tagging is in its early stages and needs industry standards, additional investment, better industry know-how, and more data scientists on the job (see Figure 14). Although not all data would be valued even if tagged, there still exists (and will continue to exist) a large gap between the actual amount of tagged data and the amount that could benefit from tagging.
As Figure 14 shows, IDC estimates that by the end of 2025, only 15% of the data in the global datasphere will be tagged and only one-fifth of that will actually be analyzed.
However, there is also the potential for automated data tagging using cognitive/AI technologies. While this approach is in its formative years, many data integration tools and systems are now building cognitive/AI capabilities in them to help automate the process of data tagging using various types of machine learning, including supervised, unsupervised, and reinforcement learning.
Security as a Critical Foundation
With the changes in data sources, usage, and value, the amount of data being created is shifting from being consumer-driven to enterprise-driven. In 2015, enterprises created less than 30% of data, while this figure will be nearly 60% in 2025. (Note that prior to 1980, enterprises created and managed nearly all data.) Regardless of where the data is created, enterprises must face the challenge of managing more than 97% of the global datasphere. Take the example of user-generated content on social media. Although individuals upload personal videos and photographs and write text content, the social media site ultimately must store and manage the data on its infrastructure. Having access to and managing a growing amount of such personal data gives enterprises greater responsibility in managing privacy and security risks.
Moreover, as embedded sensors increase in number, nonchalant transactions are mined for data, and additional personal data capture rises; hence, the need for data security only increases.
Some data types don’t carry hard security requirements today, including camera phone photos, digital video streaming, public website content, and open source data. However, most data do, such as corporate financial data, personally identifiable information (PII), and medical records.
The percentage of data requiring security will near 90% by 2025, and this data falls into five categories (see Figure 15):
• Lockdown. Information requiring the highest security, such as financial transactions, personnel files, medical records, and military intelligence
• Confidential. Information that the originator wants to protect, such as trade secrets, customer lists, and confidential memos
• Custodial. Account information that, if breached, could lead to or aid in identity theft
• Compliance-driven. Information such as emails that might be discoverable in litigation or subject to a retention rule
• Private. Information such as an email address on a YouTube upload
Figure 15: Data Requiring Security
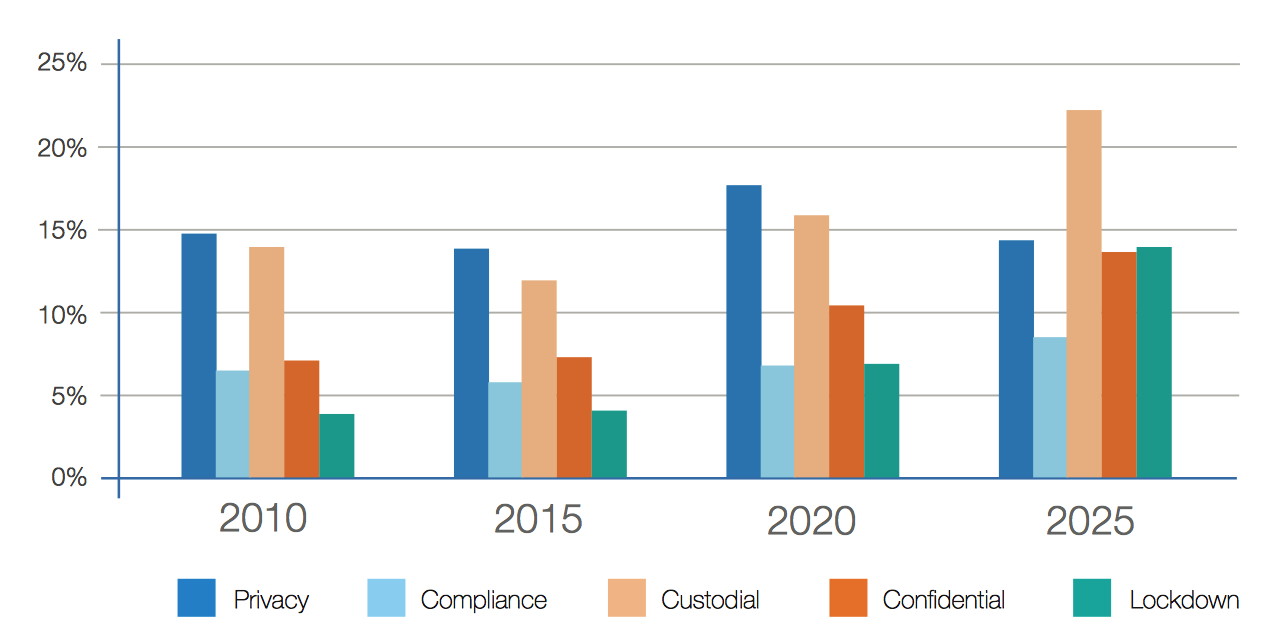
Surprisingly, while the vast majority of data requires at least some form of protection, the actual amount of data protection falls far short of that (see Figure 16). This gap presents an unambiguous increasing industry need for security and privacy technologies, systems, and processes to address it.
Figure 16: Actual Status of Data Security
Conclusion
There is a massive opportunity for data to affect positive change on all of human society. Not only is data making business more effective, but it is in the process of transforming every aspect of the individual’s life. Not only do new-paradigm services like those from Uber and Netflix depend on data, but the same is true for our cities, hospitals, stores, businesses of all type, and soon every single aspect of human society. We are finding ways for data to make our lives better that we didn’t imagine even a few years ago.
The way society uses data is going through a fundamental shift:
• From entertainment to productivity
• From business focused to hyperpersonal
• From structured to unstructured
• From selective to ubiquitous
• From retrospective to here and now
• From life-enhancing to life-critical
As computing power becomes increasingly distributed, moving to the cloud and into the everyday IoT devices and infrastructure that surround us, data will continue to drive fundamental improvements to businesses, industries, our processes, and our everyday lives. These trends are causing the total amount of all data on the planet, the global datasphere, to grow exponentially. With three-quarters of the world’s population soon to be connected, digital data will affect the life of nearly every human being, essentially becoming the lifeblood of our increasing digital existence.
The use and integration of data in businesses and our lives are quickly moving to real time. As such, data is delivered to not only inform but also determine actions – sometimes autonomously. While entertainment remains an important driver of data creation and consumption, it is ceding share to productivity data that will bring more ef ciency and automation to not only business work ows but also the everyday stream of life. Therefore, the stakes are rising and, with them, the critical importance of our data’s veracity and timeliness.
The lessons embodied in the forecast and analysis of our data-driven world include the following:
• As data becomes more life critical, business critical, real time, and mobile, the entities that manage and store it will need to develop measured approaches to increasing reliability, lowering latency, and increasing security. This process may start with audits but will need to be backed up with investment, coherent strategies, and top-notch IT talent.
• The migration of analytics from a post-activity event to a real-time and predictive enterprise will demand a step-function increase in the use of analytics for evidence-based decision making. This means not just digital transformation of an organization’s processes but also the culture and organizational structure of the organization. Analytics will become a competitive advantage.
• The security and privacy challenges cannot be underplayed. Data breaches can put companies out of business, targeted attacks can halt operations, and hacking can compromise trade secrets. The business, IT, and security professionals in an organization must continually emphasize throughout the organization that security is not simply an IT technical problem with a purely technical solution. Rather, it is an organizational need requiring the participation of employees at all levels.
• The IoT will drive – or force – merged operations between the business leaders and IT departments accustomed to supporting back-office and financial functions and those that run operational systems – labs, operating rooms, factory oors, electrical grids, cable headends, and so forth – as all digital activity migrates to IP networks. Since IoT is one of the fundamental technology pillars of business improvement in the decades to come, optimized use of associated data is one of the key drivers of business success starting today. Leadership and technical integration will be critical to making the best use of IoT technology or at least avoiding chaos.
• The aggregate effect of the trends driving the global datasphere to new zettabyte levels is to make digital transformation an all-hands-on-deck effort for organizations to navigate the next decade successfully. It will also drive increasing reliance on third parties, from cloud providers and software firms to the baseline technology suppliers. Thus vendor selection will better be seen as a leadership function and partnering function rather than a procurement function. The organization will depend on it.
The 163ZB global datasphere projected in Data Age 2025 is only the beginning as we anticipate the increasingly connected and data-driven world. A decade in technology years can, and likely will, bring about unforeseen advancements, use cases, businesses, and life-changing services that rely on the digital lifeblood called data. The storage industry and all its participants will find no lack of customers looking to store their precious bits, which will help drive even the most intimate parts of our businesses and lives across the globe and make up part of our global datasphere.




 Subscribe to our free daily newsletter


