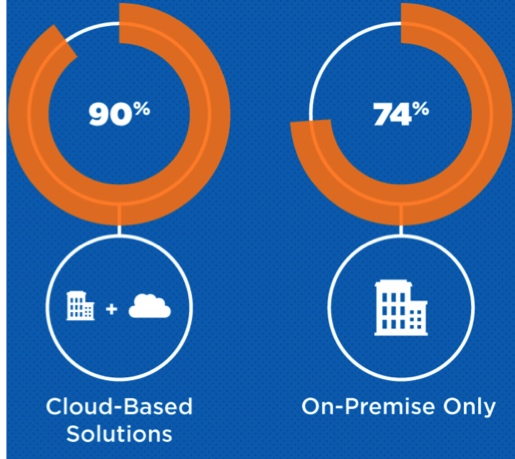
90% of IT Professionals Using Cloud in Their DR Solution Are Confident – Zetta Survey
Power outages, hardware and human errors, virus/malware attacks top causes of downtime events
This is a Press Release edited by StorageNewsletter.com on November 24, 2016 at 2:38 pmCloud-based DR is breeding greater confidence in IT pros.
90% IT pros who are using cloud in their DR solution are confident in their DR strategy, while only 74% of IT pros who use on-premise DR solutions alone feel confident in their DR strategy.
In addition, IT pros reveal that the most common causes of downtime events are not natural disasters but power outages, hardware errors, human errors and virus/malware attacks.
These are among the findings of the of Disaster Recovery 2016 Survey, performed by Zetta, Inc., provider of BC solutions.
Most Common Causes of IT Downtime
In the past five years, more than half (54%) of IT pros report having experienced a data outage of more than eight hours. Contrary to popular belief, these events of extended downtime are most frequently due to more common events, rather than natural disasters.
Most common causes of downtime survey respondents experienced
include:
- Power outage (75%)
- Hardware error (53%)
- Human error (35%)
- Virus/malware attack (34%)
- Data corruption (26%)
- Unexpected updates and patches (24%)
- Natural disaster (20%)
- Expected updates and patches (20%)
- Onsite disaster (11%)
“While many think of DR as preparing for catastrophic natural events, most IT downtime can be caused by simple power outages, hardware and human errors and, increasingly, security vulnerabilities. However, that certainly doesn’t mean that the DR event is any less critical or costly,” said Mike Grossman, CEO, Zetta. “This study reveals, that even as organizations improve their disaster readiness, they still fall behind in planning and testing their strategy. Yet, this is rapidly shifting as DR confidence grows with the increasing move towards cloud-based DR solutions.”
Reliability is Critical
When asked about the most important factor in a DR solution, reliability clearly claims the first spot (54%) followed by usability and simplicity (16%), cost (16%), and speed of recovery (15%). The importance of reliability in a DR solution is likely driven by the high cost of downtime. In fact, two-thirds (67%) estimate that their business would lose more than $20,000 in a downtime event, while 27% report that downtime would cost more than $100,000 per event.
Yet, the cost of downtime has an impact that goes much further than hard costs. IT pros state that they would be most concerned with loss of employee productivity (29%), followed by delayed product/service deliver (26%), loss of revenue (24%), damage to company brand/reputation(11%), loss of customers (65) and incurring significant recovery cost (4%).
Having a downtime event is also moving IT pros to reevaluate their DR solution. In fact, following their last downtime incident more than half (55%) of organizations changed their DR strategy or approach, 55% changed or added additional DR technology and 39% increased their DR investments. A quarter (24%) are planning to increase their DR testing frequency or process.
Increasing Need for DR Planning and Testing
The survey found that two in five (40%) companies still don’t have a documented DR plan and the same number (40%) of companies only test their DR plans once a year. Another 28% rarely, if ever, test their DR plan.
Planning, however, shows a direct relationship in DR confidence. As many as 78% of those that are confident in their DR strategy have a documented plan, while only 38% of those who are very unconfident have a DR plan. In addition, larger organizations, with more than 500 employees, are more apt to have a DR plan (74%), while only 54% of companies with less than 500 employees have a documented DR plan.
As part of its 2016 State of Disaster Recovery, Zetta surveyed 403 IT pros to learn about their DR experiences, solutions and plans, pain points and how they prepare for and respond to downtime events.
The survey was conducted online between October 5 and 19, 2016 and included organizations in 23 industries, ranging in size from less than 50 to more than 1,000 employees.


 Subscribe to our free daily newsletter

