Understanding and Monitoring Latency for Amazon EBS Volumes using Amazon CloudWatch
Metrics allow to root cause performance impacts and quickly take recovery actions to ensure applications’ reliability and resiliency on Amazon EBS.
This is a Press Release edited by StorageNewsletter.com on December 30, 2024 at 2:00 pm
By Samyak Kathane, senior solutions architect, focuses on AWS Storage technologies like Amazon EFS,

and Parnika Singh, product manager, Amazon EBS team, Amazon Web Services.
Organizations are continuing to build latency-sensitive applications for their business-critical workloads to ensure timely data processing. To make sure that their applications are working and performing as expected, users need effective monitoring and alarming across their infrastructure stack so they can quickly respond to disruptions that may impact their businesses.
Storage plays a critical role in making sure applications are reliable. Measuring I/O performance can help users process mission-critical data more efficiently, right-size their resources, and detect any underlying infrastructure issues to make sure their applications continue to thrive in the face of evolving demands. Amazon Elastic Block Store (Amazon EBS) is a high-performance block storage offering within the AWS cloud that is most suitable for mission-critical and I/O-intensive applications, such as databases or big data analytics engines. Users need to get insight into their volumes’ performance to quickly identify and troubleshoot application performance bottlenecks.
In this post, we walk through how users can monitor Amazon EBS performance using the new average latency metrics and performance exceeded check metrics in Amazon CloudWatch. These metrics are available today by default at a one-minute granularity at no additional charge for all EBS volumes attached to EC2 Nitro instances. You can use these new CloudWatch metrics to monitor I/O latency in EBS volumes and identify if the latency is a result of under-provisioned EBS volumes. For real-time visibility into volume performance, you can read the post, Uncover new performance insights using Amazon EBS detailed performance statistics. The detailed performance statistics are directly available from the Amazon EBS NVMe device attached to the Amazon Elastic Compute Cloud (Amazon EC2) instance at sub-minute granularity.
Amazon EBS overview
Amazon EBS offers SSD-based volumes and HDD-based volumes. Within the SSD portfolio are the General Purpose (gp2, gp3) volumes and Provisioned IO/s (io1, io2 Block Express) volumes. General Purpose gp3 volumes are designed to deliver single-digit millisecond average latency and are suitable for most workloads. Provisioned IO/s io2 Block Express (io2 BX) volumes are designed to deliver sub-millisecond average latency and are best suited for your mission-critical workloads.
In this demonstration, we use an io2 BX volume to demonstrate how you can monitor average I/O latency to make sure your volume is performing as expected. We also demonstrate how you can determine if the latency observed is due to the application attempting to drive higher than provisioned IO/s or throughput. Furthermore, we show how you can use these metrics for observability through CloudWatch dashboards.
Working with the metrics
For our demonstration we’re using an r5b.2xlarge EC2 instance with an io2 BX EBS volume attached to it that is configured at 32,000 IO/s. Therefore, the IO/s and throughput limits for this volume are 32,000 and 4,000MB/s. We have created a CloudWatch dashboard and added the listed metrics to track the volume’s performance. The metrics on this dashboard are tracked at intervals of one minute. You can create a dashboard in the CloudWatch console and add individual widgets to your dashboard for the desired metrics.
- Volume IO/s: shows the number of RW I/O operations on the volume
- Volume Throughput (MB/s): shows the amount of data transferred during read and write operations on the volume
- VolumeIOPSExceededCheck: shows if an application attempts to drive IO/s that exceeds the volume’s provisioned IO/s performance
- VolumeThroughputExceededCheck: shows if an application attempts to drive throughput that exceeds the volume’s provisioned throughput performance
- VolumeAverageReadLatency (milliseconds): shows the average time taken to complete read operations
- VolumeAverageWriteLatency (milliseconds): shows the average time taken to complete write operations
Now we discuss two scenarios to explain how you can get insights into your volume performance using these metrics. In the first scenario, we monitor the metrics to determine if volume performance is within the defined guidelines. In the second scenario, we use the metrics to detect when the workload exceeds the provisioned performance limits of the volume to root cause high volume latency.
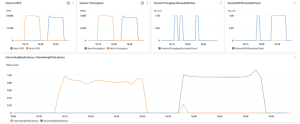
Scenario 1 (normal volume performance): In this scenario, we are driving 16 KB I/O size to the volume. You can observe the performance of our volume during this test:
Click to enlarge
 From the graph at the bottom in the preceding image, our io2 BX volume has an average read latency at or beneath 0.40 ms and average write latency at or beneath 0.25ms, which means the volume’s latency is as expected. Both the VolumeIOPSExceededCheck and the VolumeThroughputExceededCheck metrics in the top right show 0 because the volume is driving IO/s and throughput that are beneath its provisioned performance limits of 32,000 IO/s and 4,000MB/s, as shown in the 2 top left graphs.
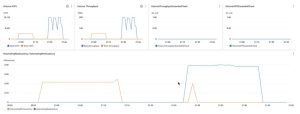
Scenario 2 (degraded volume performance): Now, we take the same io2 BX volume and, using 128KB I/O size, drive very high IO/s and throughput to this volume. This is what the volume performance looks like now:
Click to enlarge
If you look at the bottom graph, you can observe that the volume’s latency has increased. The average read latency reached a peak of 1.14ms while the average write latency reached a peak of 0.98ms. This is because the workload is trying to drive over 32,000 RW IO/s and over 4,000MB/s RW throughput that are the provisioned performance limits for this volume. You can observe this by looking at the VolumeIOPSExceededCheck and VolumeThrouputExceededCheck metrics in the two top right graphs, which both show a value of one during the impact period. This indicates that the workload is driving more than the volume’s provisioned IO/s and throughput during the period.
As highlighted in the preceding scenarios, you can track the average read latency and average write latency metrics to know if your volume is performing as intended. You can use the IO/s exceeded check and throughput exceeded check metrics to troubleshoot if the volume latency is high because you are hitting the volume’s provisioned IO/s or throughput limits. These metrics allow you to determine if your EBS volume is the source of your application’s performance impact.
Furthermore, you can use the metrics to build the right recovery mechanisms, such as increasing the performance of your volume to make sure you have sufficiently provisioned performance for your application’s needs. Using CloudWatch, you can create alarms that can notify you when a metric breaches a certain threshold. For example, you can set an alarm if your application is attempting to drive more IO/s than provisioned to the volume for three of the last five minutes, suggesting that you should increase the IO/s on your volume. You can determine different threshold values based on your application performance needs.
Your volume can experience elevated latency due to various reasons, including when your volume hits performance limits, volume initialization, or underlying infrastructure failures. You can use these alarms to set up different automated actions to make sure that your application’s availability isn’t impacted if volume latency increases. For example, your alarm can automatically invoke an AWS Lambda function to fail over to a secondary volume or to increase your volume’s provisioned performance. For more information on setting up alarm actions, read Using Amazon CloudWatch alarms.
Conclusion
In this post, we discussed how you can use the new Amazon EBS volume-level metrics to track the performance of your EBS volumes in Amazon CloudWatch. You can get insight into the per-minute average I/O latency on your volume to troubleshoot any application disruptions and identify if the performance bottleneck is a result of driving higher than provisioned IO/s or throughput on the volume. The new metrics allow you to root cause performance impacts and quickly take recovery actions to ensure your applications’ reliability and resiliency on Amazon EBS.


 Subscribe to our free daily newsletter

