


 Western Digital: Fiscal 4Q24 Financial Results
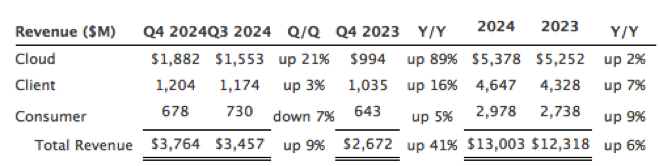
Sales at at $3.8 billion, up 9% Q/Q and 41% Y/Y, just surpasses $13 billion for FY24.
This is a Press Release edited by StorageNewsletter.com on August 1, 2024 at 3:17 pm
| (in $ million) | 4Q23 | 4Q24 | 12 mo. 23 | 12 mo. 24 |
| Revenue | 3,457 | 3,754 | 12,318 | 13,003 |
| Growth | 9% | 6% | ||
| Net income (loss) | (709) | 330 | (1,708) | (561) |
News Summary
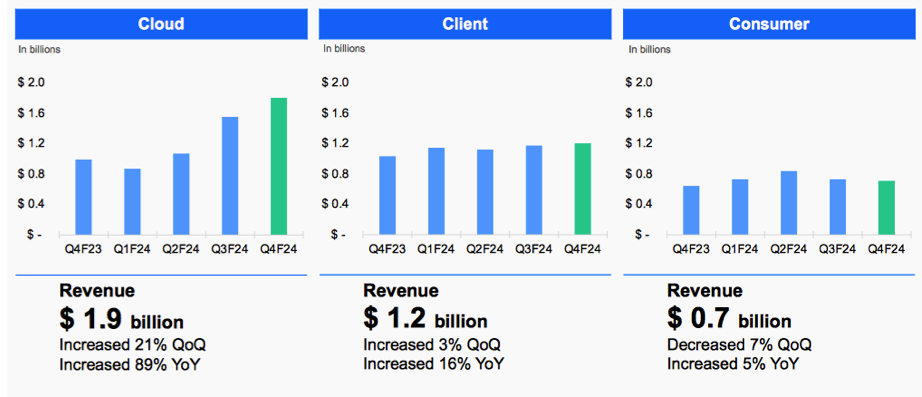
- 4FQ24 revenue was $3.76 billion, up 9% Q/Q. cloud revenue increased 21% Q/Q, client revenue increased 3% Q/Q and consumer revenue decreased 7% Q/Q. FY024 revenue was $13.00 billion.
- 4FQ24 GAAP earnings per share (EPS) was $0.88 and non-GAAP EPS was $1.44. FY24 GAAP EPS was $(1.72) and non-GAAP EPS was $(0.20).
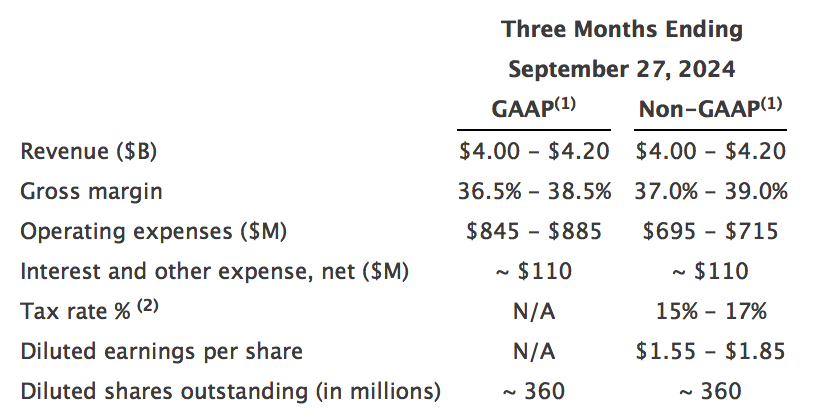
- Expect fiscal 1FQ25 revenue to be in the range of $4.00 billion to $4.20 billion.
- Expect non-GAAP EPS in the range of $1.55 to $1.85.
Western Digital Corp. reported fiscal fourth quarter and fiscal year 2024 financial results.
“Our 4FQ24 and FY24 results are reflective of the diverse and innovative portfolio we have developed in alignment with our strategic roadmap. Together, with the structural changes we have made to strengthen our operations, we are benefitting from the broad recovery we are seeing across our end markets and structurally improving through-cycle profitability for both Flash and HDD,” said David Goeckeler, CEO. “The emergence of the AI Data Cycle marks a transformational period within our industry that will drive fundamental shifts across our end markets, increasing the need for storage and creating new demand drivers. As we look ahead, we are confident in our ability to leverage our technology leadership position to capitalize on these exciting growth opportunities and deliver value for our customers.”
In 4FQ24:
- Cloud represented 50% of total revenue. The sequential growth is attributed to higher nearline shipments and pricing in HDD, coupled with increased bit shipments and pricing in enterprise SSDs. The Y/Y increase was due to higher shipments and price per unit in nearline HDDs, along with higher enterprise SSD bit shipments.
- Client represented 32% of total revenue. The sequential increase was due to the increase in flash ASPs offsetting a decline in flash bit shipments while HDD revenue decreased slightly. The Y/Y growth was driven by higher flash ASPs.
- Consumer represented 18% of total revenue. Q/Q, the decrease was due to lower flash and HDD bit shipments partially offset by higher ASPs in both flash and HDD. The Y/Y increase was driven by improved flash ASPs and bit shipments.
In FY24:
- Cloud represented 41% of total revenue. The Y/Y increase was due to higher demand for capacity enterprise HDDs and improved pricing.
- Client represented 36% of total revenue. The Y/Y increase was due to higher flash bit shipments.
- Consumer represented 23% of total revenue. The Y/Y increase was due to higher flash bit shipments.
Business outlook for 1FQ25
Comments
Western Digital delivered strong results with 4FQ24 revenue of $3.8 billion exceeding the high end of the guidance range, up 9% Q/Q and 41% Y/Y, non-GAAP gross margin of 36.3%, and non-GAAP earnings per share of $1.44. For FY24, revenue totalled $13 billion.
Revenue trends by end market
Flash and hard drive metrics
New line bit shipments were at a record level of 125EB, up 16% from 3FQ24 and 113% compared to 4FQ23. Client represented 32% of total revenue at $1.2 billion. The sequential increase of 3% was due to the increase in flash ASPs, offsetting a decline in flash bit shipments while HDD revenue decreased slightly. The 16% Y/Y growth was driven by higher flash ASPs.
Consumer represented 18% of total revenue at $0.7 billion. Q/Q, the 7% decrease was due to lower flash and HDD bit shipments, partially offset by higher ASPs in both flash and HDD. The 5% Y/Y increase was driven by improved flash ASPs and bit shipments. For FY24, revenue was $13 billion, up 6% from FY23.
Turning now to revenue by segment. In 4FQ24, flash revenue was $1.8 billion, up 3% Q/Q and 28% Y/Y. Compared 3FQ24, flash ASPs were up 14% on a blended basis and 11% on a like-for-like basis. Bit shipments decreased 7% sequentially and 3% compared to last year as the company proactively mixed flash bits to maximize profitability.
HDD revenue was $2 billion, up 14% from 3FQ24 as exabyte shipments increased 12% and average price per unit increased 12% to $163. Compared to 4FQ23, HDD revenue grew 55%, while total exabyte shipments and average price per unit were up 72% and 64%, respectively.
| in $ million | 4FQ21 |
1FQ22 |
2FQ22 |
3FQ22 |
4FQ22 |
1FQ23 | 2FQ23 | 3FQ23 |
4FQ23 | 1FQ24 |
2FQ24 | 3FQ24 | 4FQ24 | 4FQ23/4FQ24 growth |
| HDDs |
2,501 | 2,561 | 2,213 | 2,138 | 2,128 | 2,014 | 1,657 | 1,496 | 1,295 | 1,194 | 1,367 | 1,752 | 1,781 | 2% |
| Flash |
2,419 | 2,490 | 2,620 | 2,243 | 2,400 | 1,722 | 1,450 | 1,307 | 1,377 | 1,556 | 1,665 | 1,705 | 2,003 | 17% |
By business, and HDD
| Client revenue (1) |
Cloud revenue (1) |
Consumer revenue (1) |
Total HDDs (2) |
HDD ASP |
|
| 1FQ23 |
1,229 | 1,829 | 678 | 14.7 | $125 |
| 2FQ23 |
1,089 | 1,224 | 794 | 12.9 | $99 |
| 3FQ23 |
975 | 1,205 | 623 | 12.6 | $109 |
| 4FQ23 |
1,035 | 994 | 643 | 11.8 | $99 |
| 1FQ24 |
1,147 | 872 | 731 | 10.4 | $112 |
| 2FQ24 | 1,122 | 1,071 | 839 | 10.8 | $109 |
| 3FQ24 | 1,174 | 1,553 | 730 | 11.7 | $145 |
| 4FQ24 | 1,204 | 1,882 | 678 | 12.1 | $163 |
Comparison of Seagate and WD for their more recent financial quarters
| WD | Seagate | % in favor of WD | |
| Revenue | 3,754 | 1,890 | 99% |
| Y/Y Growth | 9% | 14% | -5% |
| Net income (loss) | 330 | 513 | -36% |
| Flash revenue | 2,003 | 450 | 345% |
| Y/Y growth | 17% | NA | NA |
| HDD revenue | 1,781 | 1,700 | 5% |
| Y/Y growth | 2% | 17% | -15% |
| Total HDDs shipped | 12.1 million | 11.4 million | 6% |
| HDD ASP | $163 | $141 | 16% |


 Subscribe to our free daily newsletter

