 Nutanix: Fiscal 3Q24 Financial Results
Revenue up 17% Q/Q reaching $525 million and back to loss, FY24 sales to surpass $2 billion
This is a Press Release edited by StorageNewsletter.com on June 4, 2024 at 2:01 pm| (in $ million) | 3Q23 | 3Q24 | 9 mo. 23 | 9 mo. 24 |
| Revenue | 448.6 | 524.6 | 671.6 | 802.0 |
| Growth | 17% | 19% | ||
| Net income (loss) | (71.0) | (15.7) | (241.3) | 1.3 |
Nutanix, Inc. announced financial results for its third quarter ended April 30, 2024.
“We delivered solid third quarter results reflecting disciplined execution and the strength of our business model,” said Rajiv Ramaswami, president and CEO. “Our recent announcements around modern applications, generative AI and partnerships reflect our continued focus on driving innovation and broadening our partnerships to further enhance the value proposition of Nutanix Cloud Platform.”
“Our third quarter results demonstrated a good balance of top and bottom line performance with 24% Y/Y ARR growth and strong year-to-date free cash flow generation,” said Rukmini Sivaraman, CFO. “We remain focused on delivering sustainable, profitable growth.”
4FQ24 outlook
Revenue between $530 and $540 million
FY24 outlook
Revenue between $2.13 and $2.14 billion
Comments
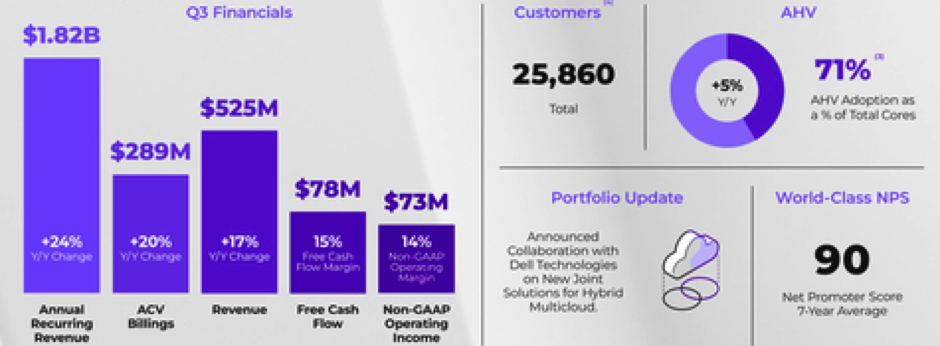
Revenue in 3FQ24 was $525 million, higher than the guided range of $510 million to $520 million, representing a Y/Y growth rate of 17%.
3FQ24 earnings summary

3FQ24 Company Highlights
- Delivers Outperformance Across All Guided Metrics: ACV billings of $288.9 million were up 20% Y/Y and revenue of $524.6 million was up 17% Y/Y.
- Raises Most FY’24 Guided Metrics: FY24 outlook raised for ACV billings, non-GAAP operating margin, non-GAAP gross margin and free cash flow.
- Announces Expanded AI Partner Program and GPT-in-a-Box 2.0: Aimed at bringing together leading AI solutions and services, and GPT-in-a-Box 2.0, with new functionalities including integrations with Nvidia Inference Microservices (NIM) and Hugging Face Large Language Models (LLMs).
- Announces Collaboration with Dell on New Joint Solutions for Hybrid Multicloud: Aimed at accelerating customers’ digital transformation journeys fueled by infrastructure modernization and modern application development.
- Announces Nutanix Kubernetes Platform (NKP): To simplify management of container-based modern applications using Kubernetes.
ARR

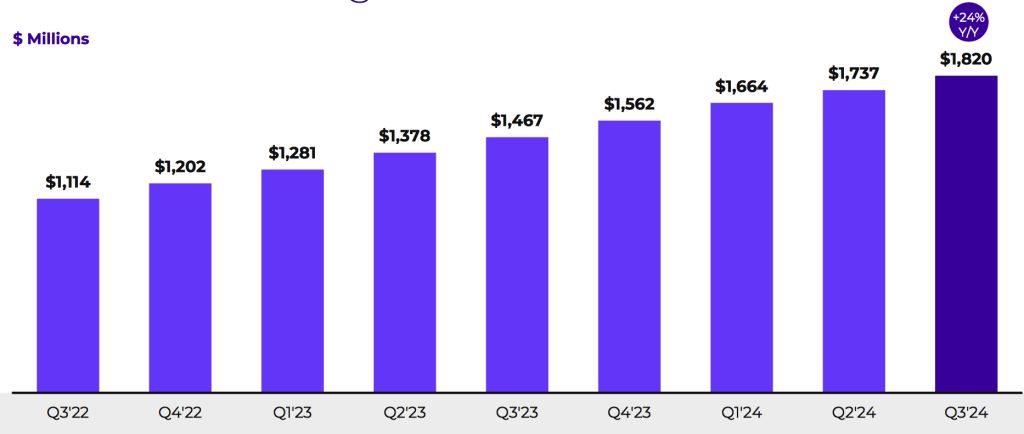
ARR at the end of 3FQ24 was $1.82 billion, representing Y/Y growth of 24%. In 3FQ24, the firm continues to see modestly elongated average sales cycles compared to historical levels. Average contract duration in 3FQ24 was 3 years higher than 2FQ24.
ACV billings in 3FQ24 were $289 million, above the guided range of $265 million to $275 million, representing Y/Y growth of 20%.
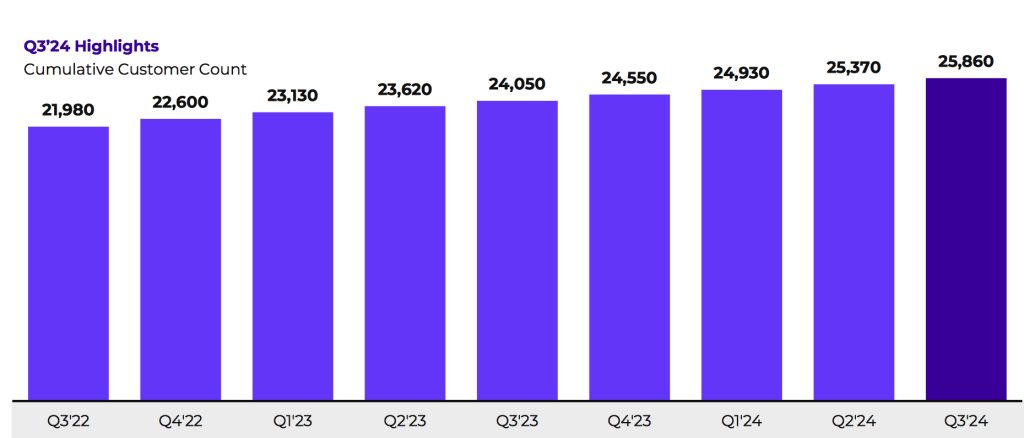
Customer growth

Nutanix ended 3FQ24 with cash, cash equivalents and short-term investments of $1.651 billion, up slightly from $1.644 billion at the end of 2FQ24.
It also had another quarter of solid free cash flow generation.
Revenue and net income (loss)
(in $ million)
| FY ended in July | Revenue | Y/Y growth | Q/Q growth | Net income (loss) |
| FY12 | 6.6 | NA | (14.0) | |
| FY13 | 30.5 | 362% | (44.7) | |
| FY14 | 127.1 | 317% | (84.0) | |
| FY15 | 241.4 | 90% | (126.1) | |
| FY16 | 444.9 | 84% | (168.5) | |
| FY17 | 845.9 | 90% | (379.6) | |
| FY18 | 1155 | 14% | (297.2) | |
| FY19 | 1136 | -2% | (621.2) | |
| FY20 | 1308 | 15% | (872.9) | |
| FY21 |
1,394 | 7% | (1,034) | |
| FY22 |
1,581 | 13% | (797.5) | |
| FY23 |
1,863 | 18% | (254.6) | |
| 1FQ24 |
511.1 | 15% | 3% | (15.9) |
| 2FQ24 |
565.2 | 16% | 11% | 32.8 |
| 3FQ24 | 524.6 | 17% | -7% | (15.5) |
| 4FQ24 (estim.) | 530-540 | 7%-9% | 1%-2% | NA |
| FY24 (estim.) |
2,130-2,140 | 14%-15% | NA |
($238 million IPO in 2016)


 Subscribe to our free daily newsletter


