 NetApp: Fiscal 4FQ24 Financial Results
Sales of $6.4 billion for FY24 up 1% Y/Y, AFA ARR of $3.6 billion up 17%
This is a Press Release edited by StorageNewsletter.com on May 31, 2024 at 2:02 pm| (in $ million) | 4Q23 | 4Q24 | 12 mo. 23 | 12 mo. 24 |
| Revenue | 1,581 | 1,668 | 6,362 | 6,268 |
| Growth | 6% | -1% | ||
| Net income (loss) | 245 | 291 | 1,274 | 986 |
NetApp, Inc. reported financial results for the fourth quarter and fiscal year 2024, which ended on April 26, 2024.
“We concluded FY24 on a high note, delivering company records for annual gross margin, operating margin, EPS, operating cash flow, and free cash flow and building positive momentum. Our modern approach to unified data storage, spanning data types, price points, and hybrid multicloud environments, is clearly resonating in the market,” said George Kurian, CEO. “In FY25, we will remain laser focused on our top priorities of driving growth in all-flash and cloud storage services while maintaining our operational discipline.”
4FQ24 financial results
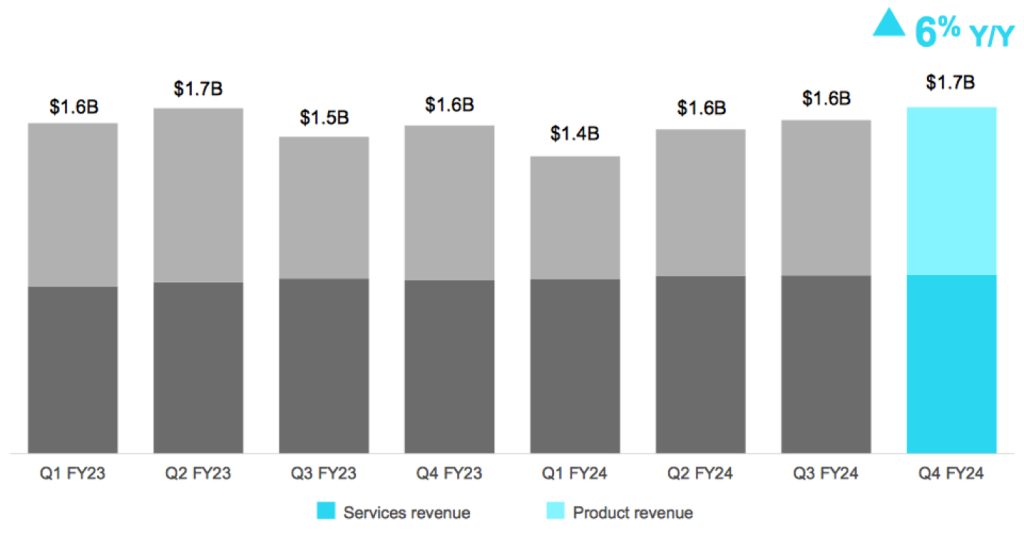
- Net revenues: $1.67 billion, compared to $1.58 billion in 4FQ23, a Y/Y increase of 6%.
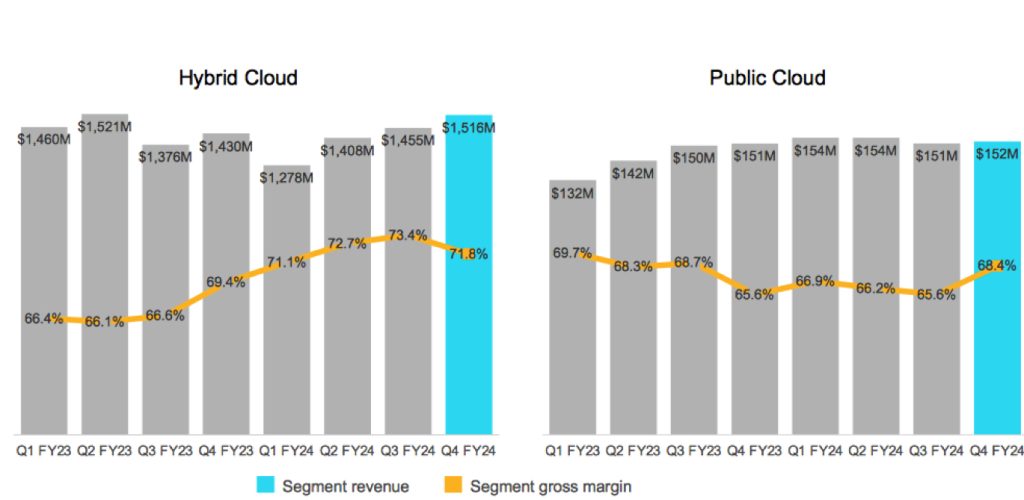
- Hybrid Cloud segment revenue: $1.52 billion, compared to $1.43 billion in 4FQ23.
- Public Cloud segment revenue: $152 million, compared to $151 million in 4FQ23.
- Billings: $1.81 billion, compared to $1.67 billion in 4FQ23, a Y/Y increase of 8%.
- Public Cloud annualized revenue run rate (ARR) $630 million, compared to $620 million in 4FQ23, a Y/Y increase of 2%.
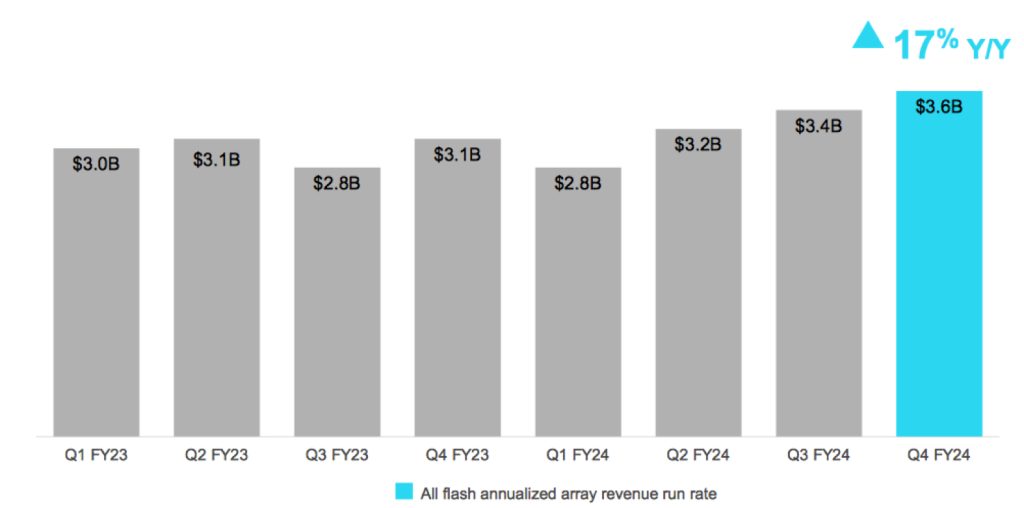
- AFA ARR: $3.6 billion, compared to $3.1 billion in 4FQ23, a Y/Y increase of 17%.
- Net income: GAAP net income of $291 million, compared to $245 million in 4FQ23; non-GAAP net income of $382 million, compared to $334 million in 4FQ23.
- Earnings per share: GAAP net income per share of $1.37 compared to $1.13 in 4FQ23; non-GAAP net income per share of $1.80 compared to $1.54 in 4FQ23.
- Cash, cash equivalents and investments: $3.25 billion at the end of 4FQ24.
- Cash provided by operations: $613 million, compared to $235 million in 4FQ23.
- Share repurchases and dividends: Returned $204 million to stockholders through share repurchases and cash dividends.
FY24 financial highlights
- Net revenues: $6.27 billion, compared to $6.36 billion in FY23, a Y/Y decrease of 1%.
- Hybrid Cloud segment revenue: $5.66 billion, compared to $5.79 billion in FY23.
- Public Cloud segment revenue: $611 million, compared to $575 million in FY23.
- Billings: $6.25 billion, compared to $6.41 billion in FY23, a Y/Y decrease of 2%.
- Net income: GAAP net income of $986 million, compared to $1.27 billion in FY23; non-GAAP net income of $1.38 billion, compared to $1.23 billion in FY23.
- Earnings per share: GAAP net income per share of $4.63 compared to $5.79 in FY23; non-GAAP net income per share of $6.46 compared to $5.59 in FY23.
- Cash provided by operations: $1.69 billion compared to $1.11 billion in FY23.
- Share repurchases and dividends: Returned $1.32 billion to shareholders through share repurchases and cash dividends.
1FQ25 outlook
Net revenue expected to be in the range of $1.455 billion-$1.605 billion
FY25 outlook
Net revenue expected to be in the range of $6.450 billion-6.650 billion
Comments
4FQ24 revenue reaches $1.668 million, slightly above the midpoint of guidance range, at $1.67 billion, up +4% Q/Q and 6% Y/Y, driven by all-flash and cloud storage portfolio, which have strong momentum as firm heads into FY25.
For 4FQ24, AFA revenue achieved a $3.6 billion annualized run rate (ARR), growing 17% Y/Y. Flash now accounts for approximately 60% of hybrid cloud revenue.
Keystone, company's SaaS offering, delivered another strong quarter and a strong year, with revenue growth up triple-digits Y/Y in FY24. And 1st party and marketplace cloud storage, the largest part of cloud business, grew double-digits Q/Q and over 30% Y/Y in 4FQ24.
Revenue

Segment revenue and gross margin

Q4 billings of $1.81 billion were up 8% Y/Y. This marks 2nd straight quarter of Y/Y revenue and billings growth.
4FQ24 Hybrid Cloud revenue of $1.52 billion was up 6% Y/Y. Product revenue was $806 million and up 8% Y/Y. Support revenue of $623 million increased 4% Y/Y. Public Cloud ARR exited the year at $630 million, up 2% Y/Y and up $22 million from 3FQ24. Public Cloud revenue composed 9% of total revenue in 4FQ24 and grew 1% yY/Y to $152 million.
Company exited FY24 with $4.23 billion in deferred revenue, a decrease of 2% Y/Y, consistent with the Y/Y decrease in 3FQ24.
4FQ24 consolidated gross margin was 71.5%. Total Hybrid Cloud gross margin was 72%. Product gross margin was 61%, 130bps ahead of prior guidance, driven by better mix and continued growth in C-series products. Recurring support business continues to be highly profitable, with gross margin of 92%. Public Cloud gross margin increased 290bps both Q/Q and Y/Y to 68%.
AFA annualized ARR

The firm delivered robust Y/Y performance in its Hybrid Cloud segment, with revenue growth of 6% and product revenue growth of 8%. Strong customer demand for portfolio of AFAs, particularly the C-series capacity flash and ASA block-optimized flash, was again ahead of expectations. This demand propelled AFA ARR run rate to an all-time high at $3.6 billion, up 17% Y/Y.
Public Cloud segment revenue was $152 million, up 1% Y/Y.
NetApp's financial results since FY16 in $ million
| Fiscal Period | Revenue | Y/Y Growth | Net income (loss) |
| FY16 | 5,546 | -9% | 229 |
| FY17 | 5,519 | -0% | 509 |
| FY18 | 5,911 | 7% | 75 |
| FY19 |
6,146 | 4% |
1,169 |
| FY20 |
5,412 | -12% |
819 |
| FY21 | 5,744 | 6% | 730 |
| 1Q22 |
1,458 | 12% | 202 |
| 2Q22 |
1,566 | 11% | 292 |
| 3Q22 |
1,614 | 10% | 252 |
| 4Q22 | 1,680 | 8% | 259 |
| FY22 | 6,318 | 10% | 937 |
| 1Q23 |
1,592 | 9% | 214 |
| 2Q23 |
1,663 | 6% | 750 |
| 3Q23 | 1,526 | -5% | 65 |
| 4Q23 | 1,581 | -6% | 334 |
| FY23 |
6,362 | 1% |
1,230 |
| 1FQ24 |
1,432 | -10% | 149 |
| 2Q24 |
1,562 | -6% | 230 |
| 3FQ24 |
1,606 | 5% | 313 |
| 4FQ24 | 1,668 | 6% | 291 |
| 1FQ25 (estim.) | 1,455-1,605 | 2% -12% | NA |
| FY25 (estim.) |
6,450-6,650 | 1% - 5% |
NA |


 Subscribe to our free daily newsletter

