


 Box: Fiscal 1Q25 Financial Results
Sales up 3% Q/Q and 5% Y/Y, $268 million to $270 million up 4% Y/Y expected for FY25
This is a Press Release edited by StorageNewsletter.com on May 29, 2024 at 2:02 pm| (in $ million) | 1Q24 | 1Q25 | Growth |
| Revenue |
251.9 | 264.7 | 5% |
| Net income (loss) | 8.4 | 17.2 |
Box, Inc. announced preliminary financial results for the first quarter of fiscal year 2025, which ended April 30, 2024.
“With the power of AI, the role of unstructured data in enterprises has exploded and the Box Intelligent Content Cloud is in a prime position to help companies fully tap into the value of their content,” said Aaron Levie, co-founder and CEO. “As we continue to execute on our innovative roadmap with the launch of Box Hubs and Box AI for Hubs, we are addressing some of the most significant challenges that our customers face in harnessing the power of AI and content.”
“We are pleased to have delivered 1FQ25 revenue growth of 5% Y/Y, or 8% in constant currency. Continued focus on operational discipline resulted in 1FQ25 operating margin and EPS both strongly above our guidance, record non-GAAP gross margin of 80%, and free cash flow growth of 14% Y/Y,” said Dylan Smith, co-founder and CFO. “We remain focused on delivering revenue growth while maintaining our commitment to continued cost savings and driving operating margin expansion.“
1FQ25 Financial Highlights
- Revenue was a record $264.7 million, a 5% increase from revenue for 1FQ24 of $251.9 million, or 8% growth on a constant currency basis.
- Remaining performance obligations as of April 30, 2024 were $1.212 billion, a 3% increase from RPO as of April 30, 2023 of $1.179 billion, or 8% growth on a constant currency basis.
- Billings were $190.5 million, a 1% decrease from billings for 1FQ24 of $191.9 million, or 5% growth on a constant currency basis.
- GAAP gross profit was a record $206.4 million, or 78.0% of revenue. This compares to a GAAP gross profit of $190.2 million, or 75.5% of revenue, in 1FQ24.
- Non-GAAP gross profit was a record $212.2 million, or 80.2% of revenue. This compares to a non-GAAP gross profit of $196.2 million, or 77.9% of revenue, in 1FQ24.
- GAAP operating income was a record $18.0 million, or 6.8% of revenue. This compares to a GAAP operating income of $8.3 million, or 3.3% of revenue, in 1FQ24.
- Non-GAAP operating income was a record $70.4 million, or 26.6% of revenue. This compares to a non-GAAP operating income of $57.4 million, or 22.8% of revenue, in 1FQ24.
- GAAP diluted net income per share attributable to common stockholders was $0.08 on 148.8 million weighted-average shares outstanding. This compares to GAAP diluted net income per share attributable to common stockholders of $0.02 in 1FQ24 on 150.4 million weighted-average shares outstanding. GAAP net income per share attributable to common stockholders includes a negative impact of $0.04 year-over-year from unfavorable foreign exchange rates.
- Non-GAAP diluted net income per share attributable to common stockholders was $0.39. This compares to non-GAAP diluted net income per share attributable to common stockholders of $0.32 in 1FQ24. Non-GAAP net income per share attributable to common stockholders includes a negative impact of $0.04 year-over-year from unfavorable foreign exchange rates.
- Net cash provided by operating activities was a record $131.2 million, a 5% increase from net cash provided by operating activities of $124.9 million in 1FQ24.
- Non-GAAP free cash flow was a record $123.2 million, a 14% increase from non-GAAP free cash flow of $108.2 million in 1FQ24.
Outlook
As a reminder, approximately one third of Box’s revenue is generated outside of USA, of which approximately 60% is in Japanese Yen.
The following guidance includes the expected impact of FX headwinds, assuming present foreign currency exchange rates. Due to the strengthening of the U.S. dollar versus the Yen since we last provided guidance, the firm now expects FX to be a 250 basis point headwind to FY25 revenue growth, 80 basis points higher than our previous expectations. For full fiscal year 2025 GAAP and non-GAAP operating margin, we now expect FX to be a headwind of 160 basis points, nearly 50 basis points higher than our previous expectations.
Additionally, as the company became consistently profitable in its international business, in 4FQ24, it released the valuation allowance vs. its deferred tax assets in the UK. Accordingly, in FY25, it is recognizing deferred tax expense in the UK. This non-cash expense is reflected in GAAP and non-GAAP diluted net income per share guidance for 2FQ25 and FY25.
2FQ25 Guidance
- Revenue is expected to be in the range of $268 million to $270 million, up 3% Y/Y at the high-end of the range, or 6% growth on a constant currency basis.
- GAAP operating margin is expected to be approximately 6.0%, and non-GAAP operating margin is expected to be approximately 27%.
- GAAP net income per share attributable to common stockholders is expected to be in the range of $0.06 to $0.07. GAAP EPS guidance includes an expected negative impact of $0.04 from unfavorable exchange rates and $0.01 from the recognition of deferred tax expenses in international countries.
- Non-GAAP diluted net income per share attributable to common stockholders is expected to be in the range of $0.40 to $0.41. Non-GAAP EPS guidance includes an expected negative impact of $0.04 from unfavorable exchange rates and $0.01 from the recognition of deferred tax expenses in international countries.
- Weighted-average diluted shares outstanding are expected to be approximately 148 million.
FY25 Guidance
- Revenue is expected to be in the range of $1.075 billion to $1.08 billion, up 4% Y/Y at the high-end of the range, or 7% growth on a constant currency basis. On a constant currency basis, this represents a $3 million increase from previous guidance.
- GAAP operating margin is expected to be approximately 6.5%, and non-GAAP operating margin is expected to be approximately 27%.
- GAAP net income per share attributable to common stockholders is expected to be in the range of $0.20 to $0.24. FY25 GAAP EPS guidance includes an expected negative impact of $0.15 from unfavorable exchange rates and $0.05 from the recognition of deferred tax expenses in international countries.
- Non-GAAP diluted net income per share attributable to common stockholders is expected to be in the range of $1.54 to $1.58. FY25 non-GAAP EPS guidance includes an expected negative impact of $0.15 from unfavorable exchange rates and $0.05 from the recognition of deferred tax expenses in international countries.
- Weighted-average diluted shares outstanding are expected to be approximately 150 million.
Comments
Revenue of $265 million was up 5% Y/Y, up 8% in constant currency, and exceeds guidance driven by strong bookings linearity.
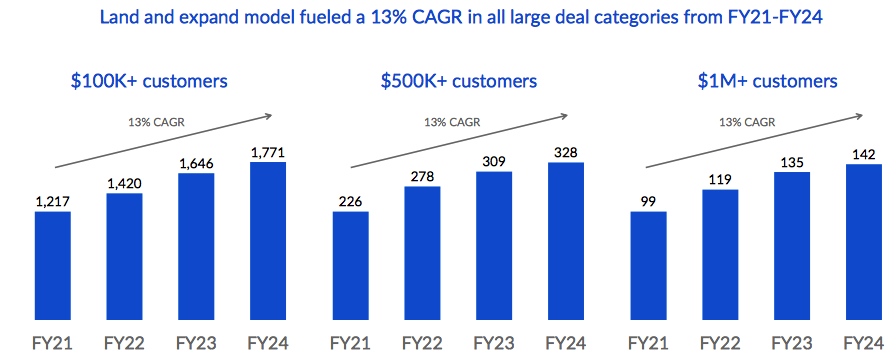
Company now has approximately 1,800 total customers paying more than $100,000 annually.
Current customer is balanced
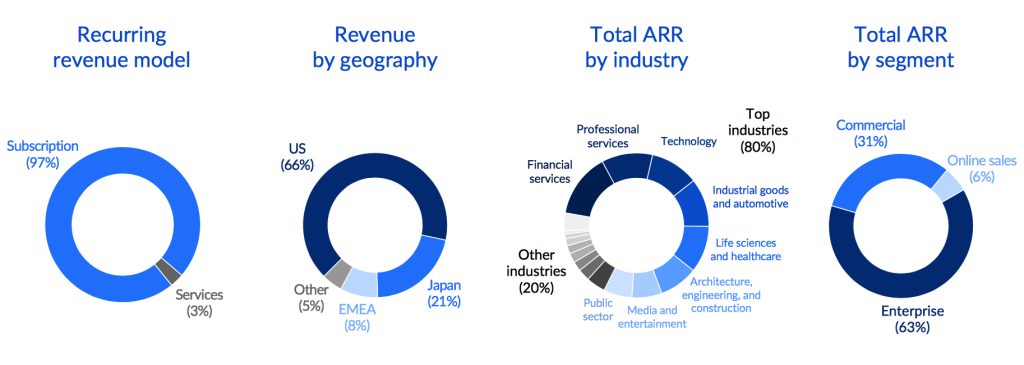
Large customer growth continues to exceed revenue growth
Suites will continue to drive revenue growth in the long-term
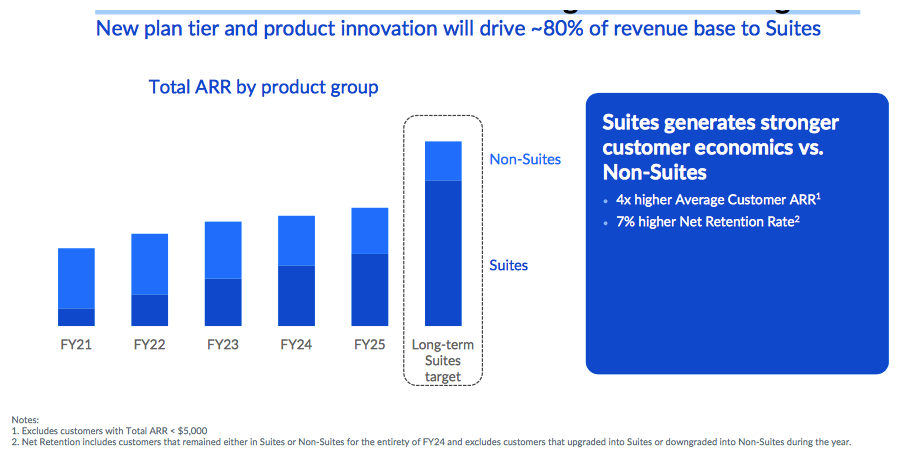
1FQ25 suites attach rate in large deals was 85%, a new high watermark and up significantly from 69% a year ago. Suites' customers now account for 56% of revenue, a strong improvement from 47% in 1FQ24.
For 2FQ25, Box expects revenue to be in the range of $268 million to $270 million, representing 3% Y/Y growth or 6% growth on a constant currency basis.
For FY25 ending January 31, 2025, it anticipates revenue in the range of $1.075 billion to $1.08 billion, representing approximately 4% Y/Y growth and 7% growth in constant currency at the high end of this range. On a constant currency basis, this represents a $3 million increase vs. prior guidance.
Revenue and net income (loss) in $million
| Period | Revenue | Y/Y growth | Net income (loss) |
| FY11 | 21.1 | NA | (53.3) |
| FY12 | NA | NA | NA |
| FY13 | 58.8 | NA | (112.6) |
| FY14 | 124.2 | 112% | (168.6) |
| FY15 | 216.4 | 74% | (168.2) |
| FY16 | 302.7 | 40% | (202.9) |
| FY17 | 398.6 | 32% | (150.8) |
| FY18 | 506.1 | 27% | (155.0) |
| FY19 | 608.4 | 20% | (134.6) |
| FY20 | 696.2 | 14% | (144.3) |
| FY21 | 770.8 | 11% | (43.4) |
| FY22 | 192.3 | 11% | (7.7) |
| FY23 | 990.9 | 13% | 26.8 |
| 1FQ24 | 251.9 | 6% | (8.3) |
| 2FQ24 | 261.4 | 6% | 10.8 |
| 3FQ24 | 261.5 | 5% | 10.7 |
| 4FQ24 | 256.5 | NA | 99.2 |
| FY24 | 1,038 | 5% | 129.0 |
| 1FQ25 | 264.7 | 5% | 17.2 |
| 2FQ25 (estim.) | 268- 270 | 3% | NA |
| FY25 (estim.) |
1.075- 1,080 | 4% | NA |
Note: IPO in 2015 raising $175 million


 Subscribe to our free daily newsletter

