 Western Digital: Fiscal 3Q24 Financial Results
Sales up 14% Q/Q and 23% Y/Y at $3.46 billion
This is a Press Release edited by StorageNewsletter.com on April 29, 2024 at 2:02 pm
| (in $ million) | 3Q23 | 3Q24 | 9 mo. 23 | 9 mo. 24 |
| Revenue | 2,803 | 3,457 | 9,646 | 9,239 |
| Growth | 23% | -4% | ||
| Net income (loss) | (571) | 135 | (975) | (837) |
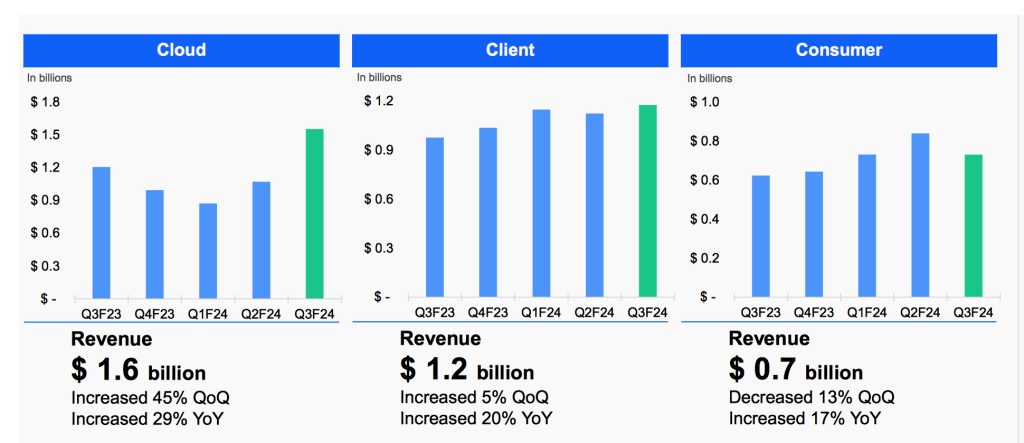
• 3FQ24 revenue was $3.46 billion, up 14% Q/Q. Cloud revenue increased 45% Q/Q, client revenue increased 5% Q/Q and consumer revenue decreased 13% Q/Q.
• 3FQ24 GAAP earnings per share (EPS) was $0.34 and non-GAAP EPS was $0.63, which includes underutilization-related charges in HDD.
• Expect 4FQ24 revenue to be in the range of $3.60 billion to $3.80 billion.
• Expect ,on-GAAP EPS in the range of $0.90 to $1.20.
Western Digital Corp. reported fiscal third quarter 2024 financial results.
“As evidenced by our excellent 3FQ24 results, Western Digital continues improving through-cycle profitability and dampening business cycles by leveraging our strategy of developing a diversified portfolio of industry-leading products across a broad range of end markets,” said David Goeckeler, CEO. “We are in the early innings of unlocking the full potential of this company, and as industry supply and demand dynamics continue to improve, we will remain disciplined around our capital spending and focused on driving innovation and efficiency across our businesses. We are confident in our strategy and the actions we have taken to-date, which successfully position us to capitalize on the promising growth prospects that lie ahead.”
The company had an operating cash inflow of $58 million and ended the quarter with $1.89 billion of total cash and cash equivalents.
In 3FQ24:
• Cloud represented 45% of total revenue. The growth was primarily attributed to higher nearline shipments and improved nearline per unit pricing with flash revenue up both Q/Q and Y/Y.
• Client represented 34% of total revenue. Q/Q, the increase in flash ASP more than offset a decline in flash bit shipments while HDD revenue decreased. The Y/Y increase was driven by growth in both flash and HDD ASPs and flash bit shipments.
• Consumer represented 21% of total revenue. Q/Q, both flash and HDD were down at approximately similar rates and in line with seasonality. The Y/Y increase was driven by growth in flash bit shipments and ASP.
Business Outlook for 4FQ24

Comments
Western Digital delivered excellent results in the quarter with revenue of $3.5 billion, up 14% Q/Q and 23% Y/Y, non-GAAP gross margin of 29.3% and non-GAAP earnings per share of $0.63, all of which exceeded expectations.
Revenue Trends by End Market

Flash and Hard Drive Metrics

| in $ million | 4FQ21 |
1FQ22 |
2FQ22 |
3FQ22 |
4FQ22 |
1FQ23 | 2FQ23 | 3FQ23 |
4FQ23 | 1FQ24 |
2FQ24 | 3FQ24 | 3FQ23/3FQ24 growth |
| HDDs |
2,501 | 2,561 | 2,213 | 2,138 | 2,128 | 2,014 | 1,657 | 1,496 | 1,295 | 1,194 | 1,367 | 1,752 | 17% |
| Flash |
2,419 | 2,490 | 2,620 | 2,243 | 2,400 | 1,722 | 1,450 | 1,307 | 1,377 | 1,556 | 1,665 | 1,705 | 30% |
By business, and HDD
| Client revenue (1) |
Cloud revenue (1) |
Consumer revenue (1) |
Total HDDs (2) |
HDD ASP |
|
| 1FQ22 |
1,853 | 2,225 | 973 | 24.1 |
$102 |
| 2FQ22 |
1,854 | 1,920 | 1,059 | 21.6 |
$97 |
| 3FQ22 |
1,732 | 1,774 | 875 | 19.8 |
$101 |
| 4FQ22 |
1,637 | 2,098 | 793 | 16.5 |
$120 |
| 1FQ23 |
1,229 | 1,829 | 678 | 14.7 | $125 |
| 2FQ23 |
1,089 | 1,224 | 794 | 12.9 | $99 |
| 3FQ23 |
975 | 1,205 | 623 | 12.6 | $109 |
| 4FQ23 |
1,035 | 994 | 643 | 11.8 | $99 |
| 1FQ24 |
1,147 | 872 | 731 | 10.4 | $112 |
| 2FQ24 | 1,122 | 1,071 | 839 | 10.8 | $109 |
| 3FQ24 | 1,174 | 1,553 | 730 | 11.7 | $145 |
Sequentially, the increase in flash ASP more than offset a decline in flash bit shipments, while HDD revenue decreased. Y/Y, the increase was driven by growth in both flash and HDD ASPs and flash bit shipments.
Consumer represented 21% of total revenue at $0.7 billion, down 13% sequentially and up 7% Y/Y. Sequentially, both flash and HDD were down at approximately similar rates and in line with seasonality.
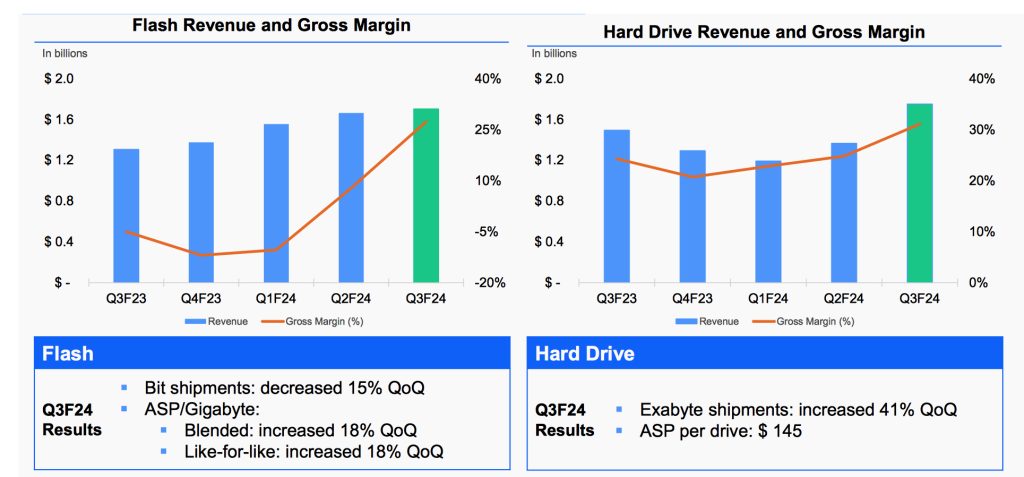
On a Y/Y basis, the increase was driven by growth in flash bit shipments and ASP. Turning now to revenue by business segment for 3FQ24, flash revenue was $1.7 billion, up 2% sequentially as ASP increased 18% on both blended and like-for-like basis. Bit shipments decreased 15% from last quarter as the company proactively focused its flash bit placement to maximize profitability.
Flash revenue grew 30% from 3FQ23 on higher bits and ASP. HDD revenue was $1.8 billion, up 28% from last quarter, as exabyte shipments increased 41% and average price per unit increased 19% to $145. Compared to 3FQ23, HDD revenue grew 17%, while total exabyte shipments and average price per unit were up 25% and 33%, respectively.
Cloud customers continue to transition to SMR with our 26TB and 28TB UltraSMR drives, quickly becoming a significant portion of capacity enterprise exabyte shipments. SMR-based drives represented approximately 50% of nearline exabyte shipments in the quarter.
Looking ahead, the manufacturer anticipates bit shipments to remain flat into 4FQ24 and look to flash ASP increases to be the primary revenue growth driver, led by focus on allocating bits to the most high-value end markets amid the tightening supply environment. While the firm is pleased to see pricing trends moving in a positive direction, it's crucial to acknowledge the importance of maintaining capital discipline and only reinvesting capital back into the business once profitability improves further, and the company sees sustained demand.
For 4FQ24, non-GAAP guidance is as follows: revenue in the range of $3.6 billion to $3.8 billion and project sequential revenue growth in both HDD and flash; in HDD, continued momentum with SMR product portfolio aimed at the cloud; in flash, anticipated bits to be flat and ASP up as firm continues optimizing its bit placement to maximize profitability.
Comparison of Seagate and WD for their more recent financial quarters
| WD | Seagate | % in favor of WD | |
| Revenue | 3,457 | 1,655 | 109% |
| Y/Y Growth | 23% | -11% | NA |
| Net income (loss) | 135 | 25 | 440% |
| Flash revenue | 1,705 | 178 | 958% |
| Y/Y growth | 30% | -30% | NA |
| HDD revenue | 1,752 | 1,477 | 19% |
| Y/Y growth | 35% | -8% | NA |
| Total HDDs shipped | 11.7 million | 11.4 million | 3% |
| HDD ASP | $145 | $130 | 12% |


 Subscribe to our free daily newsletter


