 Commvault: Fiscal 3Q24 Financial Results
Up 17% ARR and 11% revenue growth Y/Y, but decreasing next quarter
This is a Press Release edited by StorageNewsletter.com on January 31, 2024 at 2:02 pm| (in $ million) | 3Q23 | 3Q24 | 9 mo. 23 | 9 mo. 24 |
| Revenue | 195.1 | 216.8 | 581.1 | 616.0 |
| Growth | 11% | 6% | ||
| Net income (loss) | (0.3) | 17.1 | 7.7 | 42.8 |
Commvault Systems, Inc. announced its financial results for the fiscal third quarter ended December 31, 2023.
“This was one of the strongest quarters in our history with double digit ARR and revenue growth, and robust free cash flow generation,” said Sanjay Mirchandani, president and CEO. “As enterprises face non-stop cyberattacks and threats, the introduction of our new Commvault Cloud platform gives our customers groundbreaking strategies to stay resilient and also positions us for accelerated growth in fiscal year 2025.”
3FQ24 highlights
• Total revenue was at $216.8 million, up 11% Y/Y
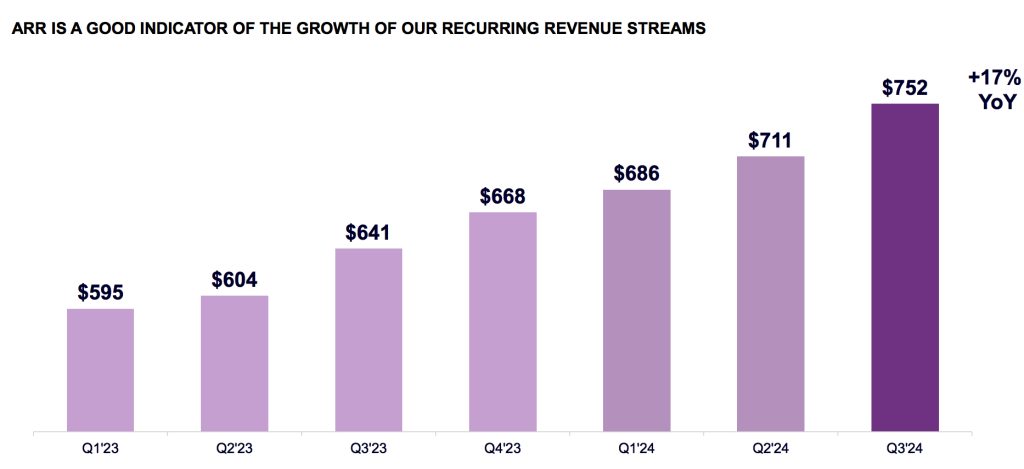
• Total ARR grew to $752 million, up 17% year Y/Y
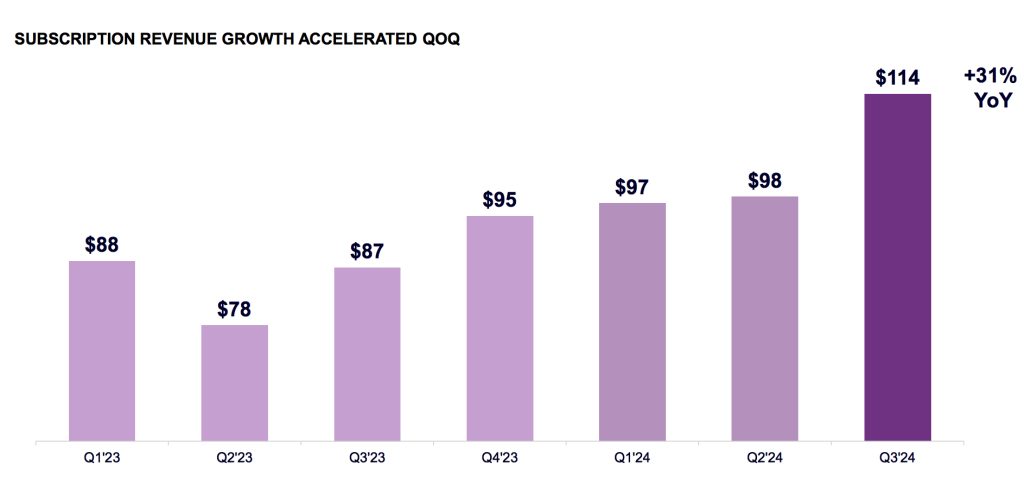
• Subscription revenue was $114.2 million, up 31% Y/Y
• Subscription ARR grew to $571 million, up 29% Y/Y
• Income from operations (EBIT) was $21.1 million, an operating margin of 9.7%
• Non-GAAP EBIT was $46.7 million, an operating margin of 21.5%
• Operating cash flow was $44.4 million, with free cash flow of $42.6 million
• Third quarter share repurchases were $51.3 million, or approximately 711,000 shares of common stock
Guidance for 4FQ24:
• Total revenue is expected to be between $210 million and $214 million
• Subscription revenue is expected to be between $111 million and $115 million
• Non-GAAP operating margin2 is expected to be between 20% to 21%
Guidance for FY24:
• Total revenue is expected to be between $826 million and $830 million
• Total ARR is expected to grow 15% Y/Y
• Subscription revenue is expected to be between $420 million and $424 million
• Subscription ARR is expected to grow 25% Y/Y
• Non-GAAP operating margin is expected to grow between 50 to 100 basis points Y/Y
• Free cash flow is expected to be approximately $170 million
Comments
Revenue of $216.8 million is much better than what was expected in 2FQ24 ($206 to $210 million).
Total revenue growth was highlighted by a 31% Y/Y increase in subscription revenue to $114 million, reflective of double-digit growth in term software licenses and an accelerating contribution of SaaS revenue.
Firm's execution was strong as large software deal close rates improved sequentially and it delivered vs. largest term subscription renewal quarter of the fiscal year. This execution resulted in term software deals over $100,000, up 25% Y/Y, driven by increases in both ASP and deal volume.
Subscription revenue ($million) includes software portion of term-based licenses and SaaS revenue

Total ARR ($million)

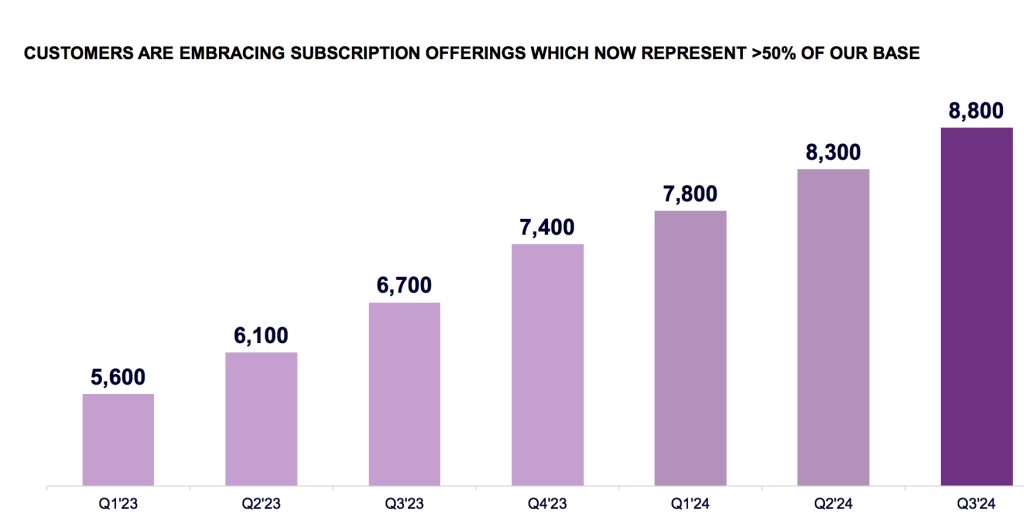
Subscription Customer Growth

In 3FQ24, Commvault added another 500 subscription customers, bringing its total to almost 9,000. Subscription customers now represent over half of our total active customer base.
3FQ24 perpetual license revenue was $15 million as these perpetual licenses are generally sold in limited verticals and geographies. At the current run rate, the company believes that the headwinds to its reported total revenue growth for perpetual license sales are normalizing as it exits the current fiscal year. 3FQ24 customer support revenue, which includes support for both term-based and perpetual software licenses, was $77 million, down 1% Y/Y. 3FQ24 and FY24 continue to benefit from the continued trend of fewer conversions of perpetual support contracts to term software licenses.
Year-to-date, customer support revenue from perpetual licenses represents 54% of total customer support, with a balance coming from term software and related arrangements. This compares to approximately 60% in FY23 and 75% in FY22. At this trajectory, the firm expects customer support revenue from term-based software licenses to become the majority of its customer support revenue next fiscal year.
The company expects FY24 revenue between $826 and $830 million up 5% to 6% Y/Y, a record in its history since FY15, better figures that ones announced last quarter.
Revenue and net income (loss) in $ million
| Fiscal Period | Revenue | Y/Y growth |
Net income (loss) |
| FY15 | 607.5 | 4% | 25.7 |
| FY16 | 595.1 | -2% | 0.1 |
| FY17 | 650.5 | 9% | 0.5 |
| FY18 | 699.4 | 8% | (61.9) |
| FY19 | 711.1 | 2% |
3.6 |
| FY20 |
670.9 |
-6% |
(5.6) |
| FY21 | 723.5 | 8% | (31.0) |
| FY22 | 769.6 | 6% | 33.6 |
| 1FQ23 | 198.0 | 8% | 3.5 |
| 2FQ23 | 188.1 | 6% | 4.5 |
| 3FQ23 | 195.1 | -4% | (0.3) |
| 4FQ23 | 203.5 | -1% |
(43.5) |
| FY23 | 784.6 | 2% |
(35.8) |
| 1FQ24 | 198.2 | -3% |
12.6 |
| 2FQ24 | 201.0 | 7% |
13.0 |
| 3FQ24 | 216.8 | 11% |
17.1 |
| 4FQ24 (estim.) | 210-214 | 3%-5% |
NA |
| FY24 (estim.) | 826-830 | 5%-6% | NA |


 Subscribe to our free daily newsletter

