 Macronix: Fiscal 4Q21 Financial Results
14% of sales for NAND flash, down 11% Q/Q and up 125% Y/Y
This is a Press Release edited by StorageNewsletter.com on February 15, 2022 at 2:01 pm| (in NTD million) | 4Q20 | 4Q21 | FY20 | FY21 |
| Revenue | 10,158 | 14,545 | 39,801 | 50,573 |
| Growth | 43% | 27% | ||
| Net income (loss) | 1,156 | 3,692 | 5,326 | 11,963 |
Macronix International Co., Ltd. announced the unaudited financial results for the fourth quarter ended Dec. 31, 2021. All numbers were prepared in compliance with the TIFRS on a consolidated basis.
Summary of 4FQ21:
- Net sales was NT$14,545 million ($523.9 million).
- Gross profit was NT$6,863 million ($247.2 million) with 47.2% gross margin.
- Operating income was NT$4,094 million ($147.5 million) with 28.1% operating
margin. - Income before tax was NT$4,041 million ($145.6 million); net income was
NT$3,692 million ($133.0 million). - EPS was NT$2.00; book value per share was NT$25.20.
4FQ21Financial Highlights:
Net sales of NT$14,545 million ($523.9 million), a decrease of 3% sequentially and an increase of 43% Y/Y.
Gross profit and Gross margin was NT$6,863 million ($247.2 million) and 47.2%, respectively. Gross profit was increased 7% sequentially and increased 109% year-over-year.
Operating expenses for this quarter were NT$2,769 million ($99.7 million), a decrease of 5% Q/Q and an increase of 50% Y/Y. Operating income for this quarter was NT$4,094 million ($147.5 million), an increase of 17% Q/Q and an increase 185% Y/Y.
Income before taxes was NT$4,041 million ($145.6 million), a decrease of 34% Q/Q and an increase of 199% Y/Y.
The income tax expense was NT$349 million ($12.6 million), the net income after tax was NT$3,692 million (US$133.0 million).
EPS was NT$2.00 (US$0.07).
For this quarter, the book value was NT$25.20 per share.
Current assets and cash flow:
- As of December 31, 2021, the debt-to-asset ratio was 39.1% which was lower than 41.6% on September 30, 2021.
- As of Dec. 31, 2021, the company had NT$18,565 million ($670.7 million) in cash and cash equivalents.
- As of December 31, 2021, net inventory was NT$13,156 million ($475.3 million), compared to NT$13,313 million on September 30, 2021, a decrease of NT$157 million.
- As of December 31, 2021, the total liabilities was NT$29,983 million ($1,083.2 million), compared to NT$30,662 million on September 30, 2021, a decrease of NT$679 million; Shareholders’ equity was NT$46,725 million ($1,688.0 million).
- Depreciation and amortization expenses were NT$1,106 million ($39.8 million) for this quarter. Net cash flow from operating activities was NT$7,043 million ($253.7 million) for this quarter. Capital expenditure for this quarter was NT$2,542 million ($91.6 million) mainly for the procurement of facility and production equipment.
4FQ21 Business Highlights
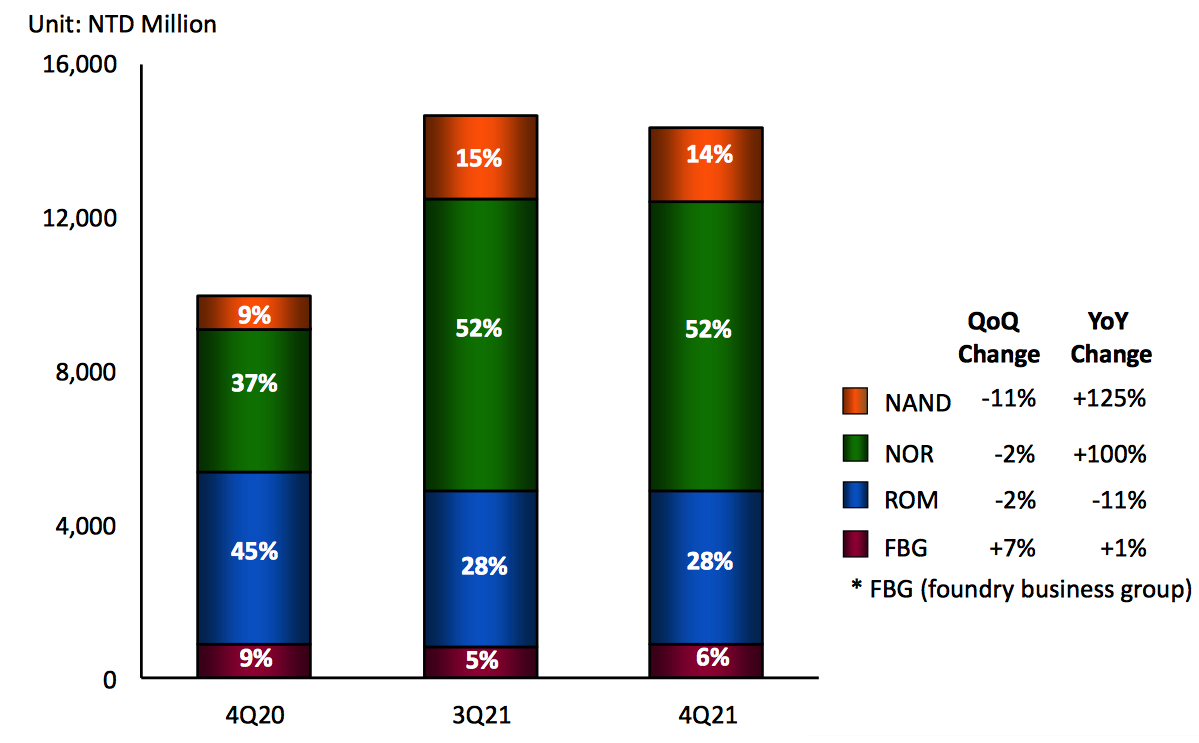
- NAND flash, NOR flash and ROM represent 14%, 52% and 28% of the net sales, respectively
- NAND flash products accounted for 14% of net sales, a sequential decrease of 11% and an increase of 125% Y/Y.
- NOR flash products accounted for 52% of net sales, a sequential decrease of 2% and an increase of 100% Y/Y.
- ROM revenue accounted for 28% of net sales, a sequential decrease of 2% and a decrease of 11% Y/Y.
- FBG products accounted for 6% of net sales, a sequential increase of 7% and an increase of 1% Y/Y.
Comments
Quarterly sales by products

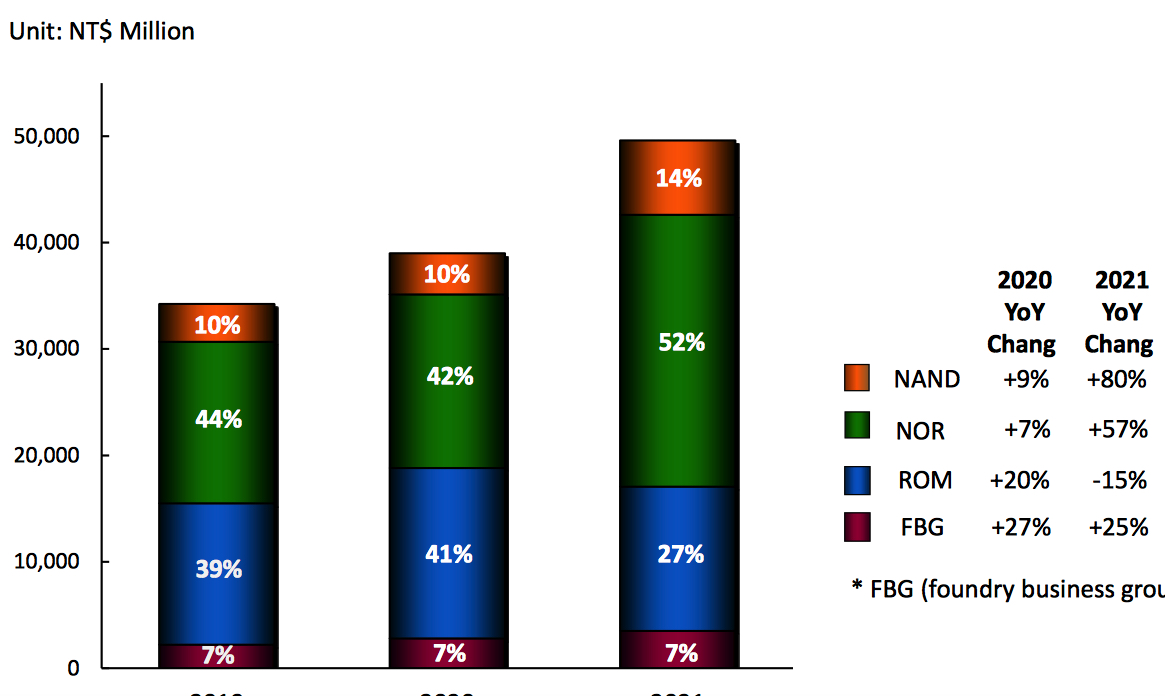
Annual sales by products

NOR business
• 4Q21 density shipments continued to remain high, +55% Y/Y and -7% Q/Q
• 55nm continued to expand the penetration, +55% Y/Y and +7% Q/Q, representing 58% of density shipment in 4Q21
• ASP hike continued, mainly on strong demand from target markets
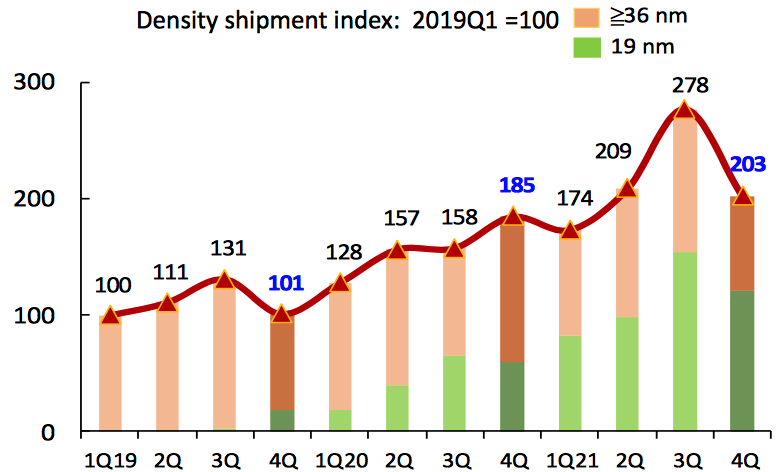
SLC NAND business
• 19nm represented 59% of density shipment in 4Q21
• 4Q density shipment down mainly due to strategic capacity allocation
• ASP hike continued


 Subscribe to our free daily newsletter

