 NetApp: Fiscal 4Q21 Financial Results
Sales and profit up, but bad outlook for next quarter
This is a Press Release edited by StorageNewsletter.com on June 4, 2021 at 2:32 pm| (in $ million) | 4Q20 | 4Q21 | FY20 | FY21 |
| Revenue | 1,401 | 1,555 | 5,412 | 5,744 |
| Growth | 11% | 6% | ||
| Net income (loss) | 196 | 344 | 819 | 730 |
NetApp, Inc. reported financial results for the fourth quarter and fiscal year 2021, which ended on April 30, 2021.
“We delivered fourth quarter results above expectations, capping off a solid year of growth. Our momentum underscores our value to customers in a hybrid, multi-cloud world. We are gaining share in key storage markets and our public cloud services are at a scale where they are positively impacting total company billings and revenue growth,” said George Kurian. “Our focused execution last year has set us up well for FY22. I am excited about the year ahead and confident in our ability to grow revenue while delivering operating leverage as we support our customers on their cloud and digital transformation journeys.”
4FQ21 financial results
• Net revenue: $1.56 billion, compared to $1.40 billion in 4FQ20
• Net income: GAAP net income of $334 million, compared to $196 million in 4FQ20; non-GAAP net income4 of $268 million, compared to $265 million in 4FQ20
• Earnings per share: GAAP net income per share5 of $1.46, compared to $0.88 in 4FQ20; non-GAAP net income per share of $1.17, compared to $1.19 in 4FQ20
• Cash, cash equivalents and investments: $4.60 billion at the end of 4FQ21
• Cash provided by operations: $559 million, compared to $383 million in 4FQ20
• Share repurchase and dividends: Returned $181 million to shareholders through share repurchases and cash dividends
FY21 financial results
• Net revenues: $5.74 billion, compared to $5.41 billion in FY20
• Net income: GAAP net income of $730 million, compared to $819 million in FY20; non-GAAP net income of $917 million, compared to $944 million in FY20
• Earnings per share: GAAP net income per share of $3.23, compared to $3.52 in FY20; non-GAAP net income per share of $4.06, compared to $4.05 in FY20
• Cash provided by operations: $1.33 billion compared to $1.06 billion in FY20
• Share repurchase and dividends: Returned $552 million to shareholders through share repurchases and cash dividends
1FQ22 outlook
Net revenues are expected to be in the range of $1.37 billion to $1.47 billion
FY22 financial outlook
Net revenues are expected to grow in the range of 6% to 7%. Public cloud ARR is expected to exit the fiscal year in the range of $425 million to $500 million
Dividend
The company will increase 1FQ22 dividend by 4% to $0.50 per share. The quarterly dividend will be paid on July 28, 2021, to shareholders of record as of the close of business on July 9, 2021.
Share repurchase program
The firm authorized an additional $500 million for the repurchase of shares of its common stock under its existing share repurchase program.
NetApp announced that Carrie Palin, former SVP and CMO of Splunk, has joined as a member of the board of directors.
Comments
Well-managed NetApp is the only firm growing quarterly among the top 5 worldwide companies mainly in storage systems. All the other 4 ones saw revenue declining Q/Q.
Comparison of most recent financial results of top 5 companies mainly in storage systems
| Firm | Fiscal quarter in 2021 ending in |
Revenue on storage only |
Q/Q growth | Y/Y growth | Net income (loss) |
| Dell* | April 30 | 4,409 | -14% | -1% | NA |
| NetApp | April 30 | 1,555 | 6% | 11% | 344 |
| HPE* | April 30 | 1,137 | -5% | -9% | NA |
| IBM* | March 31 | NA | NA | -14% | NA |
| Pure Storage | May 2 | 412.7 | -18% | 12% | (84.2) |
Revenue and net income (loss) in $ million
* storage only
** storage products only
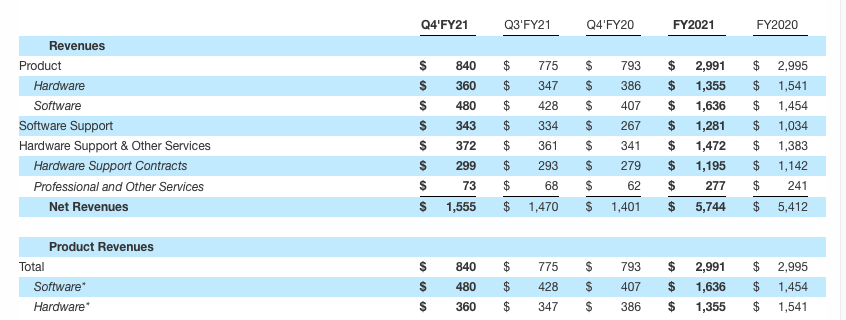
Quarterly revenue reached $1.56 billion, above guidance of $1.44 billion to $1.54 billion, up 6% Q/Q and 11% Y/Y. And sales grew each quarter of FY21, all of them profitable, a rarity in this business.

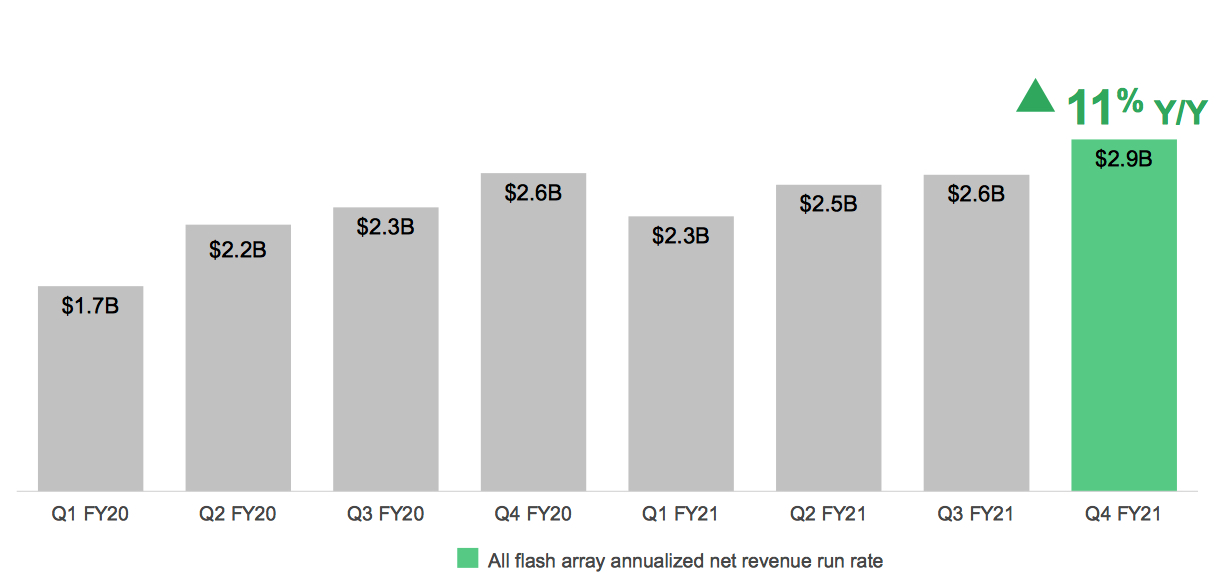
Product revenue of $840 million increased yearly 6%. Continued share gains in hybrid and all-flash arrays drove product revenue growth of 6% Y/Y, reaching $2.9 billion run rate up 11% Y/Y.
AFA annualized net revenue rate

Software and recurring support and cloud revenue grew 17% Y/Y at $641 million; composed 41% of total revenue.
Software product revenue of $480 million increased 18% Y/Y, driven by the continued mix shift towards firm's AFA portfolio.
Cloud Volume, Cloud Insights, and Spot drove growth in cloud services ARR to $301 million, +171% Y/Y.
Free cash flow of $521 million marked an all-time high, representing 34% of revenue.
Over FY21, the company added 1,500 new customers with public cloud services and grew total cloud customer count by 137% from 4FQ20.
1FQ22 outlook
Net revenues are expected to be in the range of $1.37 billion to $1.47 billion which, at the midpoint, implies a 9% increase in revenues Y/Y. The storage company expects consolidated gross margin to be 68% and operating margin between 19% and 20%. Assumed in this guidance are 1FQ22 operating expenses of $680 million to $690 million.
FY22 outlook
Net revenues are expected to grow in the range of 6% to 7% Y/Y with billings expected to outpace revenue given the continued strength in recurring support contracts and cloud services. The firm expects continued momentum and share gains in its cloud-connected all-flash portfolio. It will also continue to grow and invest in its diversified public cloud services portfolio. It raised the low-end its FY22 guide and now expects to exit FY22 with public cloud ARR of $425 million to $500 million, driven by enhanced go-to-market activities, cloud partnerships and continued product innovation.
Similar to the seasonal pattern experienced in FY21, NetApp anticipates 3FQ22 and 4FQ22 to be its strongest quarters for net new public cloud ARR. This seasonal cadence is driven by its semi-annual sales compensation plans. As CEO noted, its firm has increased confidence in its ability to eclipse $1 billion in public cloud ARR in FY25.
In FY22, it expects gross margin to be flat Y/Y at 67% to 68%, as improving cloud margins are balanced with strong demand for hybrid cloud products. It anticipates operating margin to range between 21% and 22%. Implied in this guidance is an expectation that operating expenses will be between $2.75 and $2.8 billion. The Y/Y increase in expense base is being driven by continued investment in revenue generating activities, including expanding cloud portfolio, targeted investments in sales resources and continued investment in sales team.
CEO George Kurian concluded: "Going into FY22, we had 2 clear priorities: returning to growth in our storage business powered by share gains from our industry-leading file, block and object software and scaling our highly differentiated public cloud services business."
NetApp's financial results since FY2016
| Fiscal Period | Revenue | Y/Y Growth | Net income (loss) |
| FY16 | 5,546 | -9% | 229 |
| FY17 | 5,519 | -0% | 509 |
| 1Q18 | 1,325 | -11% | 136 |
| 2Q18 | 1,422 | 7% | 175 |
| 3Q18 | 1,523 | 7% | (506) |
| 4Q18 | 1,641 | 8% | 271 |
| FY18 | 5,911 | 7% | 75 |
| 1Q19 |
1,474 | 12% |
283 |
| 2Q19 |
1,517 | 7% |
241 |
| 3Q19 |
1,563 | 2% |
319 |
| 4Q19 |
1,592 | -3% |
296 |
| FY19 |
6,146 | 4% |
1,169 |
| 1Q20 |
1,236 | -16% | 103 |
| 2Q20 |
1,371 | -10% | 243 |
| 3Q20 |
1,404 | -10% | 277 |
| 4Q20 |
1,401 | -12% | 196 |
| FY20 |
5,412 | -12% |
819 |
| 1Q21 |
1,303 | 5% | 77 |
| 2Q21 |
1,416 | 3% | 137 |
| 3Q21 |
1,470 | 5% | 182 |
| 4Q21 |
1,555 | 11% | 344 |
| FY21 | 5,744 | 6% | 730 |
| 1Q22* |
1,370-1,470 | 5%-13% | NA |
| FY22* | 6,089-6,146 | 6%-7% | NA |
Revenue and net income (loss) in $ million
* Outlook


 Subscribe to our free daily newsletter

